Simplify railway field maintenance with R&S®Scope Rider RTH user apps

Oscilloscopes are basic everyday instruments for engineers and electricians. Maintenance tasks, however, sometimes require very specific measurements that are not available as standard functionality or are difficult to set up manually. With the R&S®RTH-K38 user scripting option, engineers can now design their own measurement function and a simple user interface. This paper describes how to use this unique feature for railway maintenance work.

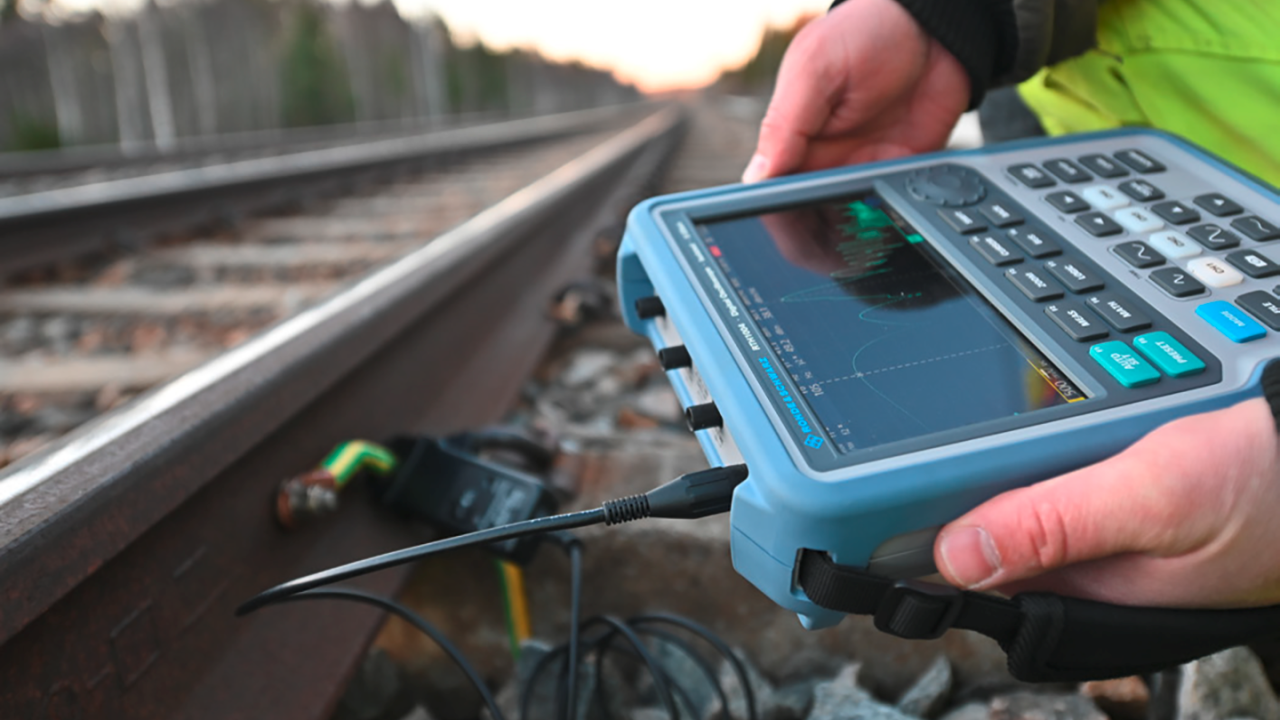
Measure railway track isolation at different frequencies (© Øystein Grue)

Your task

Railway engineers often need to verify the quality of electric communications signals, for example to determine the position of a train on its track. This is usually done by dividing the track into sections of rail with alternating frequencies, typically 95 Hz and 105 Hz. When a train is located within a specific section, the wheels short circuit the signal, indicating the position of the train to the receiver. If the isolation between sections or other electrical systems (e.g. the power distribution system) is not sufficient, unwanted noise signals can interfere, making train detection unreliable. Verifying the isolation of the track at various frequencies is a necessary maintenance task in railway service operations.

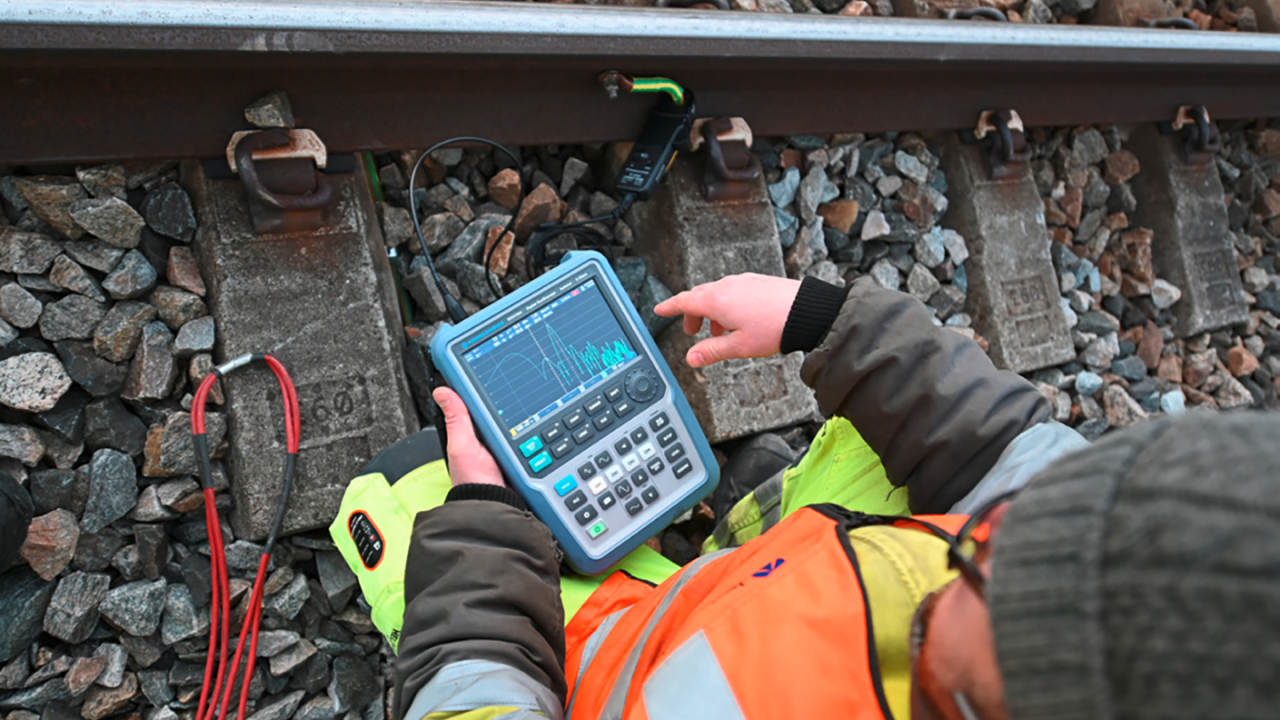
ScopeRider RTH oscilloscope in spectrum mode measuring (copyright - Øystein Grue)
The R&S®ScopeRider RTH oscilloscope in spectrum mode measuring the spectral content of the communications signal (© Øystein Grue)
Open Lightbox

Individual measurement requirements

The frequencies can be easily measured with the R&S®RTH-K18 spectrum analysis option. It allows the engineers to measure and log the spectral content at defined frequencies using cursors and the logging functionality of the oscilloscope. In this use case, it is necessary to measure a signal current at four different frequencies (16 2/3 Hz, 50 Hz, 95 Hz and 105 Hz) and display the signal amplitude in Ampere at these frequencies. Such a specific measurement is certainly not a standard functionality on any handheld oscilloscope. There was also a request for an automatically executed setup on the device, a display of the maximum values of the currents and a graphical representation in order to make operation as simple as possible for the engineers.

Measurements with user apps

The R&S®RTH-K38 user scripting option allows the engineers to run user-defined JavaScript programs directly on the oscilloscope to perform individual, non-standard measurement tasks. The user script controls the instrument via standard SCPI commands and communicates with the operator via an intuitive, web based user interface. This makes it possible to automate measurement processes and provides a much simpler user interface than an oscilloscope usually has.

The user script is a combination of HTML to provide the user interface and JavaScript to control the instrument via SCPI commands.

Automated measurement script

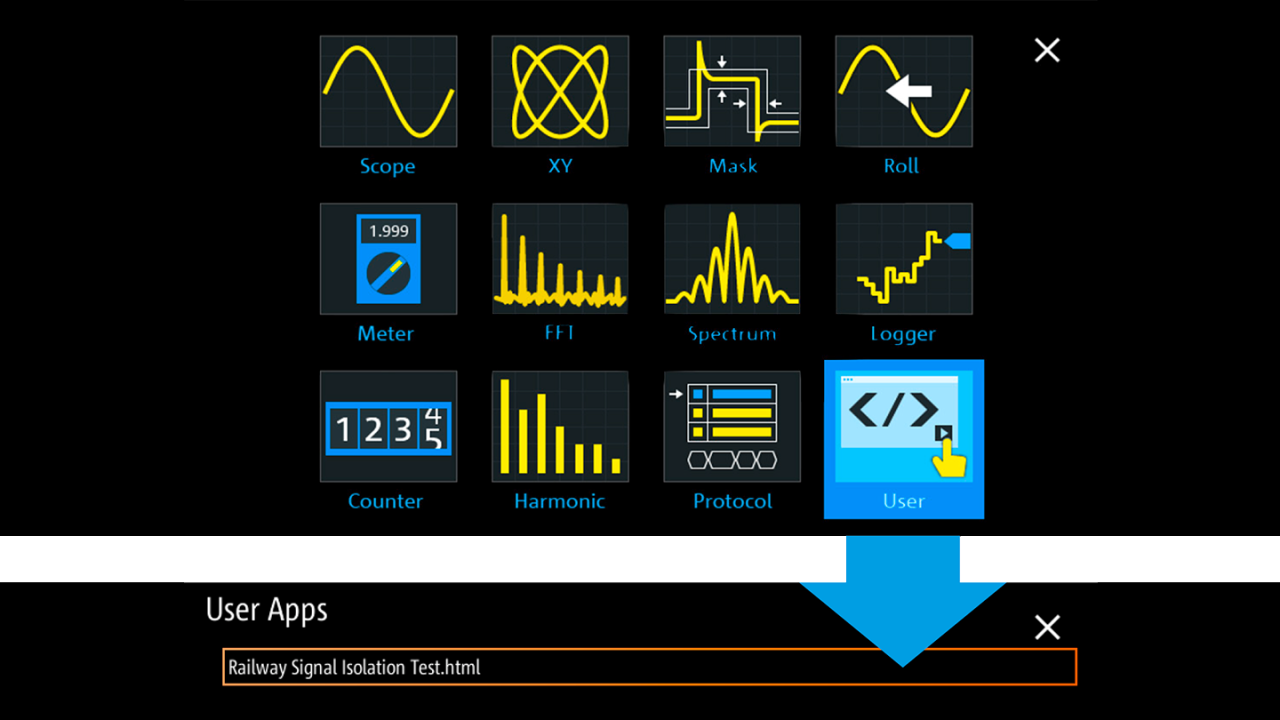
To measure the railway isolation, an R&S®RT-ZC03 current clamp is connected to the railway track and channel 1 of the R&S®RTH. Then the R&S®RTH-K38 user script option is activated. This is an extremely simple process since it only requires three interactions after instrument startup:

  • Press “Mode” to access the mode selection menu
  • Choose “User” to list available user scripts
  • Select and start the relevant user script

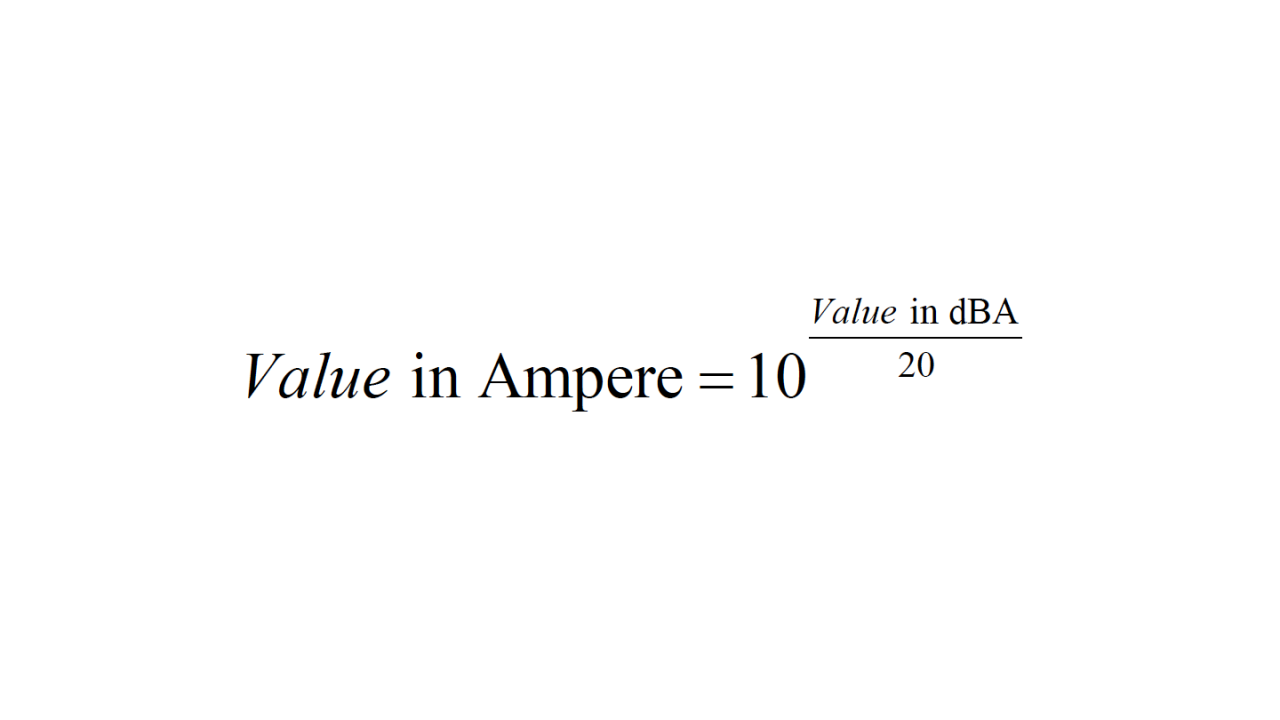
The user script automatically configures the instruments into spectrum mode, sets the cursor to the defined frequencies and reads out the spectral amplitude at the respective frequencies. The currents for the four defined frequencies are converted into Ampere from the dBA values in spectrum mode as follows:

Simplify railway field maintenance with Scope Rider RTH user apps
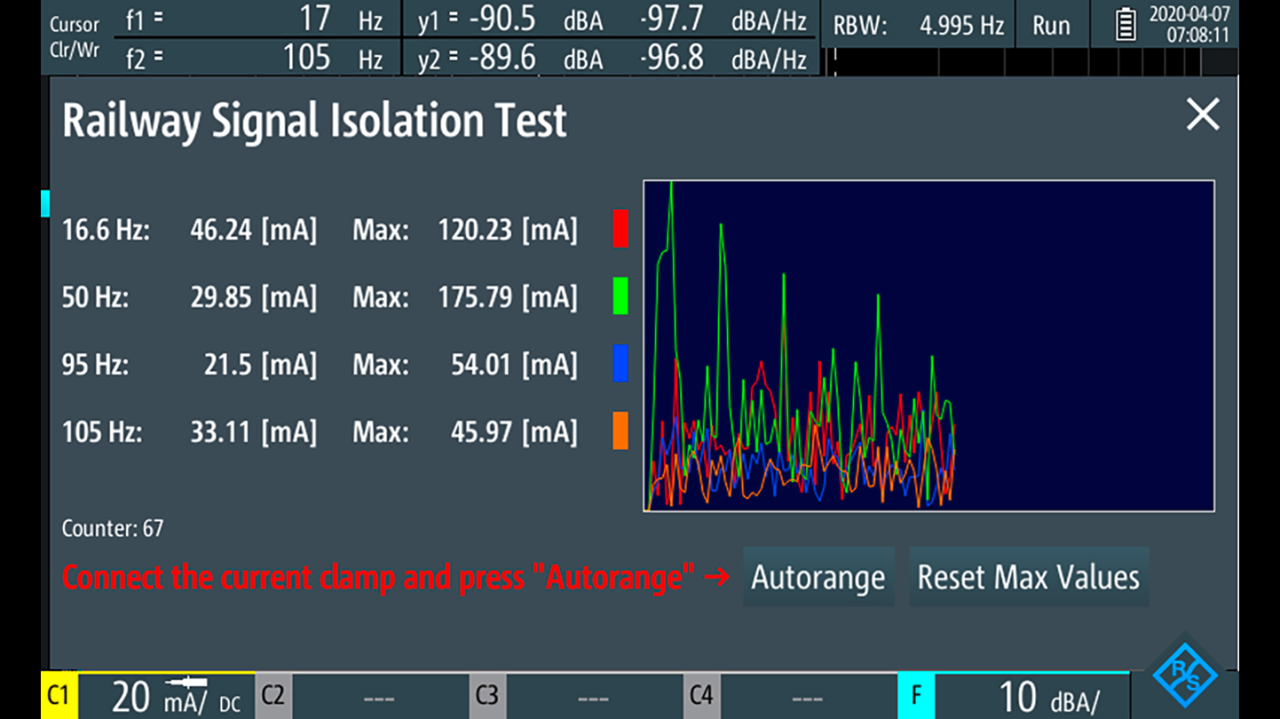
HTML is used for an easy-to-use GUI, JavaScript for easy programming and access to instrument functions via SCPI
Open Lightbox

The current values are displayed in A, mA or µA in an HTML based browser window on the oscilloscope. The script not only automates the entire measurement procedure, it also makes it possible to perform sequenced cursor measurements at more than two frequencies. In the JavaScript program, four additional variables are used to track the maximum current for each frequency and display this information. In addition, a trend plot displays and logs the current values over time with automatic adjustment of the vertical scale of the graph. To reset the maximum value and restart the measurement, a counter and a “Reset Max Values” button were added. Finally, an Autorange function automatically sets the vertical scaling of the oscilloscope to match the current values and avoid overranging.

The Mode button directly accesses all RTH analysis functions.
The ”Mode” button directly accesses all R&S®RTH analysis functions. Selecting the “User” menu lists all available user scripts.
Open Lightbox

Detailed instructions on how to generate a user script for the R&S®RTH-K38 option and how to load it onto the device can be found in the R&S®ScopeRider RTH user manual. It also includes an example user script.

The script for this case example is available at:
www.rohde-schwarz.com/software/rth/

Note: Unpack the .zip file before uploading to the R&S®ScopeRider RTH.

Summary

The R&S®RTH-K38 user scripting software option makes the R&S®ScopeRider RTH handheld oscilloscope a powerful tool for automated or guided non-standard measurements in maintenance and service applications. It allows engineers to run individual measurement scripts on the device using the built-in web browser, JavaScript and the full functionality of the instrument via SCPI commands. It also provides an easy-to-program and easy-to-use HTML user interface for fast measurement in the field.

Related solutions