Measuring power supply induced jitter and PSNR in low jitter oscillators and clocks

Timing components such as low jitter oscillators and clocks are necessary to facilitate increasing data rates in high speed digital designs. As part of the overall system design, the components also have to perform in the system’s non-ideal power integrity environment and limit the power supply induced phase noise and jitter from power rail disturbances. Measuring the power supply noise rejection (PSNR) requires accurate generation and leveling of artificial, sinusoidal disturbances and measurement of resulting phase-noise and jitter impairments.

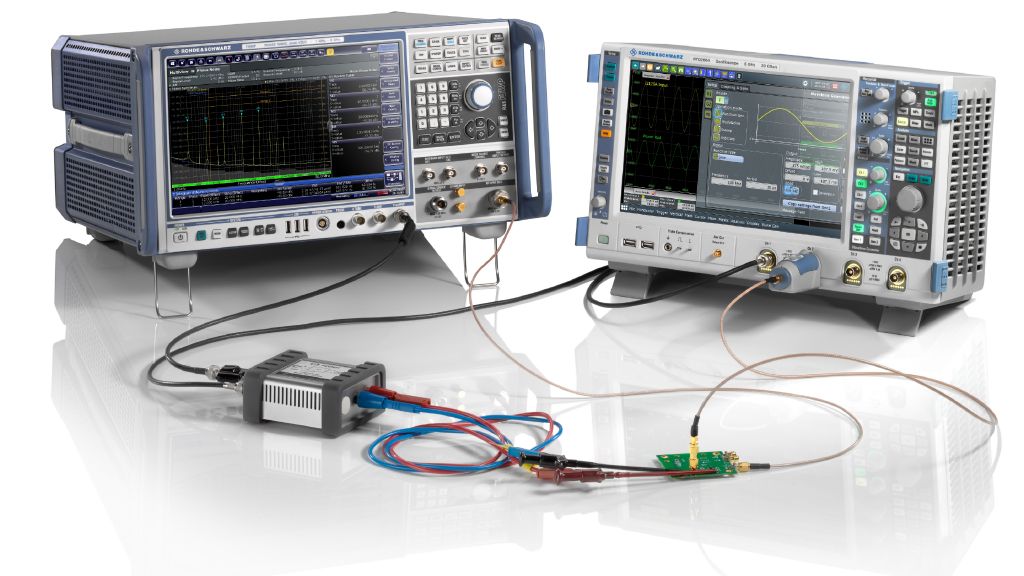
PSNR Test: Measuring power supply induced phase noise and jitter on an Epson SG3225EEN low jitter crystal oscillator.

Your task

Modern high speed network systems require low jitter (100 fs or better) oscillators and clocks. The jitter values for such components are typically specified for a 12 kHz to 20 MHz integration range. They are typically measured under ideal power rail conditions. Even though clean power rails give the best jitter value, a device still has to deliver the required jitter performance in the presence of power rail disturbances in the overall system. Power supply induced jitter rejection for power line frequencies as well as switching frequencies in DC/DC converters and harmonics are typically measured from 50 Hz to a few MHz. For testing purposes, a sinusoidal disturbance is generated and superimposed on the power rail DC voltage at the required magnitude. The resulting phase noise line (in dBm), relative to the voltage level of the artificial power rail disturbance (in dBm) equals the PSNR at this frequency point. The measurement is typically done at multiple frequency points to analyze the PSNR over the frequency range mentioned above.

Rohde & Schwarz phase noise analyzers have unrivaled sensitivity, making them the instrument of choice for measuring phase noise and jitter in low jitter devices. Sinusoidal disturbance generation and disturbance voltage measurements on the power rail can be easily performed using an oscilloscope with an integrated function generator and a dedicated power rail probe.

PSNR test setup
PSNR test setup
Open Lightbox

Rohde & Schwarz solution

Measuring an oscillator or clock jitter and PSNR performance typically involves the following:

  • Baseline measurement
    Phase noise and jitter measurement without power rail disturbance are used to determine DUT baseline performance under ideal conditions (typical jitter integration range from 12 kHz to 20 MHz)
  • PSNR measurement
    Injection: sinusoidal disturbances are injected at various frequency points to identify power supply induced phase noise and jitter (typical PSNR measurement range from 50 Hz to 5 MHz)
    Calculation: PSNR is calculated at each injection frequency as the ratio of the resulting phase noise spur (in dBm) to the disturbance voltage applied to the power rail (in dBm)
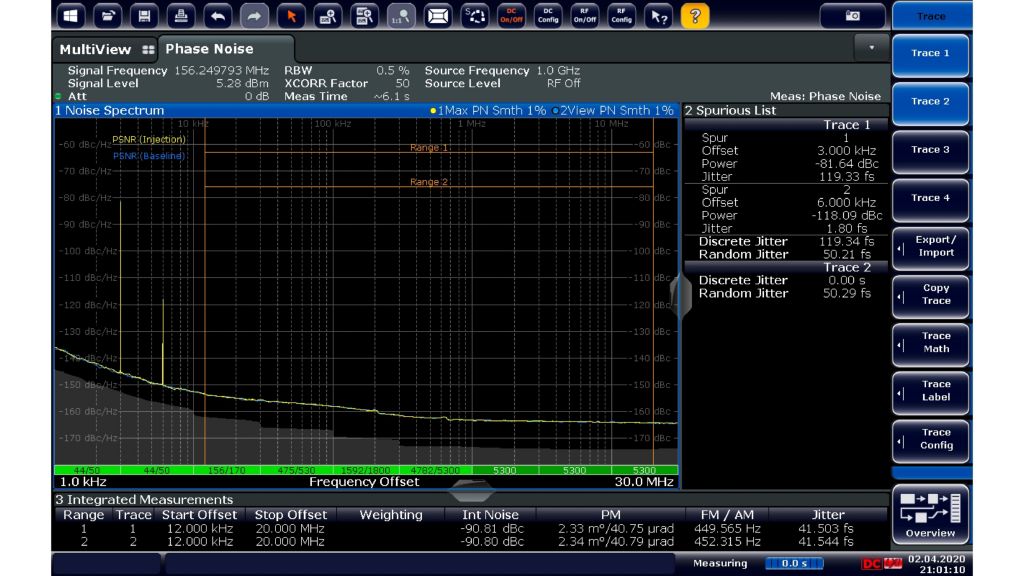
PSNR measurement of a 156.25 MHz oscillator: example, starting with an injection frequency of 3 kHz.
Open Lightbox

Phase noise measurement

The R&S®FSWP phase noise analyzer provides industry-leading phase noise and jitter sensitivity. Adding the R&S®FSWP-B60 or R&S®FSWP-B61 option further improves sensitivity through cross-correlation. The displayed cross-correlation gain indicator shows the instrument’s phase noise contribution and visualizes the margin relative to the measured phase noise trace. The R&S®FSWP can be configured to measure DUT jitter within a user-defined integration range. The example shows the 12 kHz to 20 MHz range typical for timing components in high speed communication systems. The powerful spur analysis in the phase noise analyzer depicts the spurs that result from injecting sinusoidal power rail disturbances. The instrument’s max. hold mode enables stepping of the injected disturbance frequency over the desired frequency range. The resulting spurs and their offset, level and jitter values are also displayed, enabling comfortable analysis of the PSNR results.

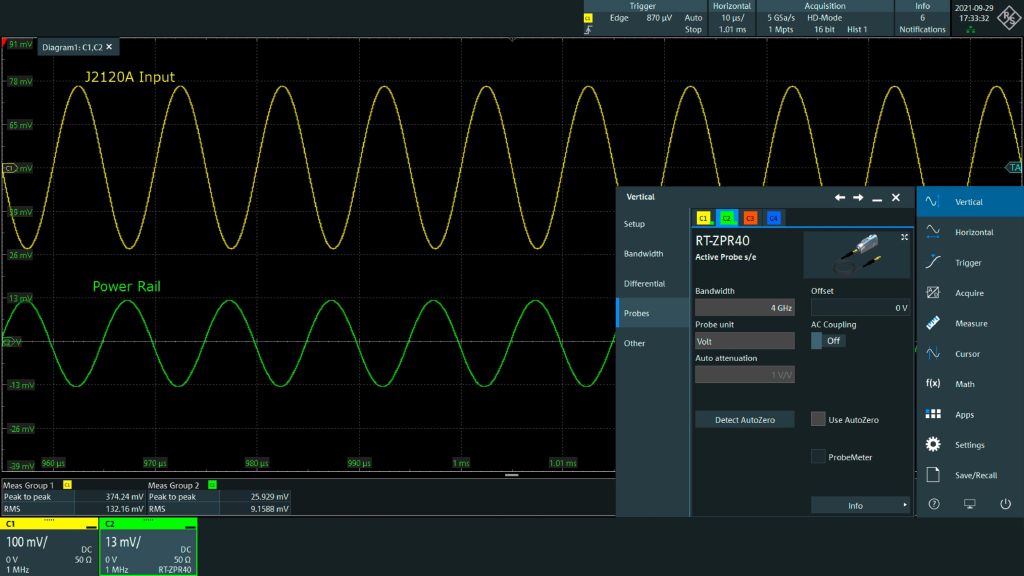
Automatic detection of the R&S®RT-ZPR20 power rail probe on the R&S®RTO2000 oscilloscope.
Open Lightbox

Generating and measuring sinusoidal disturbances

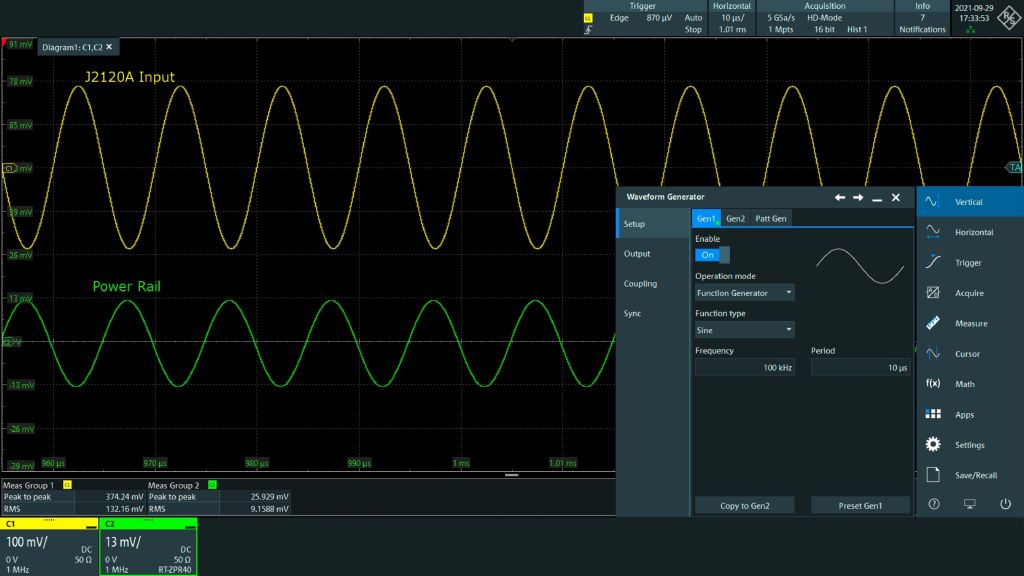
The R&S®RTO-B6 option for the R&S®RTO2000 oscilloscope provides an internal waveform generator with function generator, modulation, sweep and arbitrary configuration modes. In the example, a sinusoidal signal generated at 3 kHz, 10 kHz, 30 kHz, 100 kHz and 300 kHz is applied to the DUT power rail using a Picotest J2120A line injector. The actual voltage on the rail is measured with the R&S®RT-ZPR20 power rail probe. The function generator output is adjusted to create the wanted 10 mV RMS (–27 dBm) disturbance at each frequency point on the power rail. The R&S®RT-ZPR20 includes a built-in R&S®ProbeMeter to accurately measure power rail DC voltage. Thanks to the power rail probe’s offset compensation and low inherent noise, even the smallest disturbances can be measured accurately using the full resolution of the R&S®RTO2000 oscilloscope.

The optional R&S®RTO-K17 high definition mode increases resolution up to 16 bit, further improving measurement accuracy.

Summary

The R&S®FSWP and R&S®RTO2000 together with the optional R&S®RTO-B6 internal waveform generator provide a compact setup for measuring power supply induced phase noise and jitter on low jitter oscillators and clocks. The R&S®RT-ZPR20 power rail probe and the R&S®RTO-K17 high definition mode provide highly accurate measurements of small power rail disturbances. The PSNR values can be calculated from spur levels in the R&S®FSWP and the voltage level of the power rail disturbance.

Leveling of the injected power rail disturbance to 10 mV RMS. A 20 dB attenuator is used at the output of the R&S®RTP-B6 waveform generator for higher resolution.
Open Lightbox

Related solutions