Quickly access your favourite tools. RTP - see the difference

R&S®RTP 오실로스코프
제품 정보


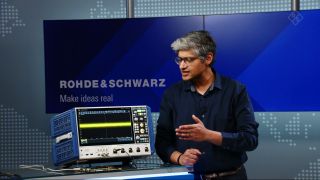
See on our debugging example how to use the powerful spectrum analysis with log display, peak list and limit lines for visualizing and evaluating the EMI emission.