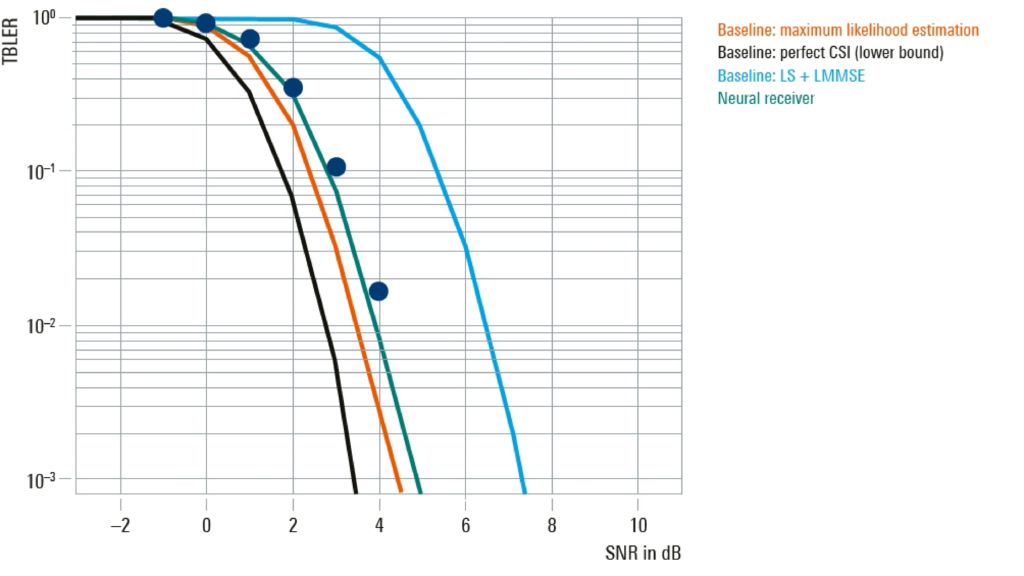
To evaluate performance, the block error rate was plotted against the signal-to-noise ratio (SNR) and compared across four different receiver implementations.
The black curve represents performance in an ideal scenario, where all channel characteristics are known. This represents the theoretical limit that can be achieved. Nothing beyond this is possible. The green curve is the neural receiver, while the orange and blue show two conventional implementations.
The first of these, the blue curve, uses the least squares method for channel estimation and a linear MMSE multi-user MIMO detector to cancel out interference. Compared to the other scenarios, the computational complexity of this implementation is relatively low and it is a good illustration of what a practical yet basic implementation looks like.
The second conventional implementation, shown by the orange curve, is based on the maximum likelihood estimation. It is more complicated and therefore requires more computation. Although the neural receiver doesn’t outperform this approach, it gets very close but with considerably less computational power. All four curves are based on simulations with the same input data.
The graph also has actual measurements in addition to the simulated lines.
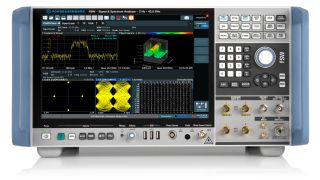
This is where Rohde & Schwarz measuring equipment comes into play. We use the signal generator and analyzer setup mentioned above to generate 3GPP 5G NR-compliant signals. This data is then fed into the architecture of the neural receiver. In this example, we’re working in the SNR area, starting at -1dB. We increase the SNR by 1 dB for each step. This is stored in the software that controls the test setup.
In the demo, two users receive different channels. In this example, user one encounters the TDL-B model with a delay spread of 100 ns and a Doppler frequency of 400 Hz. For user two, it’s TDL-C with a delay spread of 300 ns and a Doppler frequency of 100 Hz. The curves shown are the cross-sectional throughput achieved for the set signal-to-noise ratio (SNR). In the measurement with the test setup, only the (simulated) green curve is remeasured.


