Characterization of an amplifier with the combination of network and spectrum analysis

The general characterization of complex DUTs such as amplifiers requires the measurement of several parameters. Some may require more than one test device or expensive equipment. Thanks to its versatility, the R&S®ZNL is an economic solution that can characterize a variety of DUTs both via network analysis and spectrum analysis.

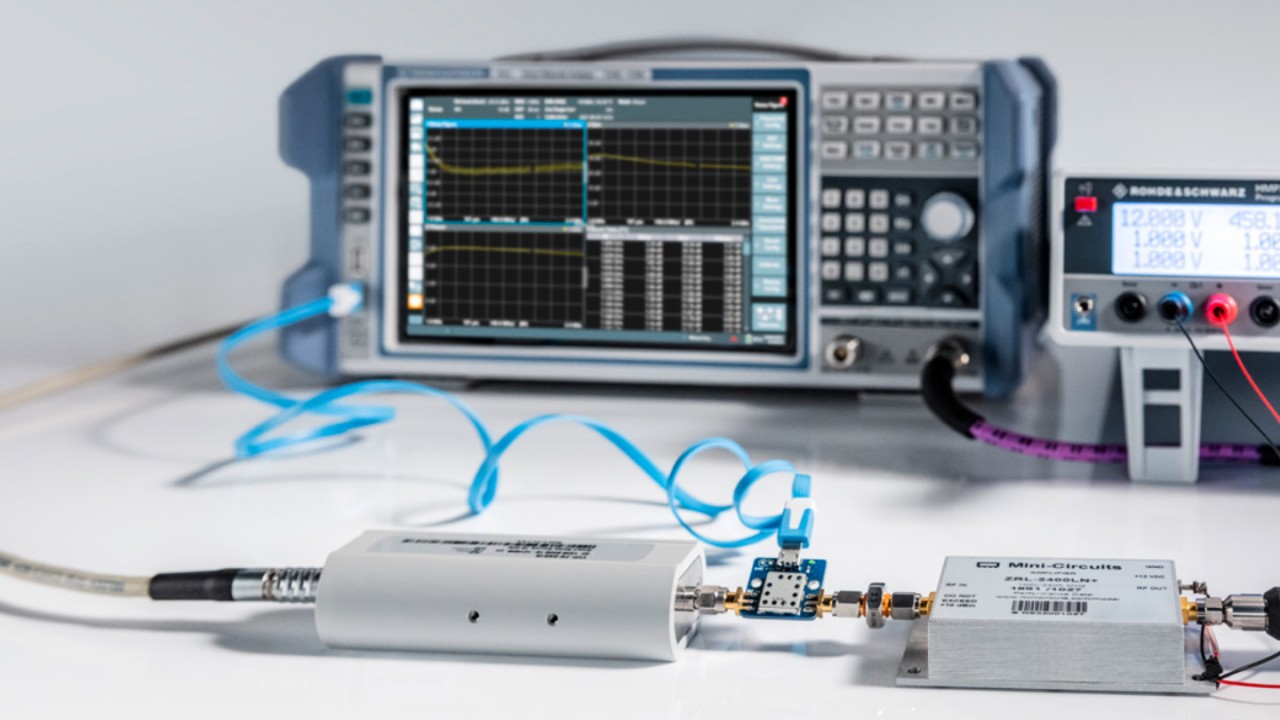
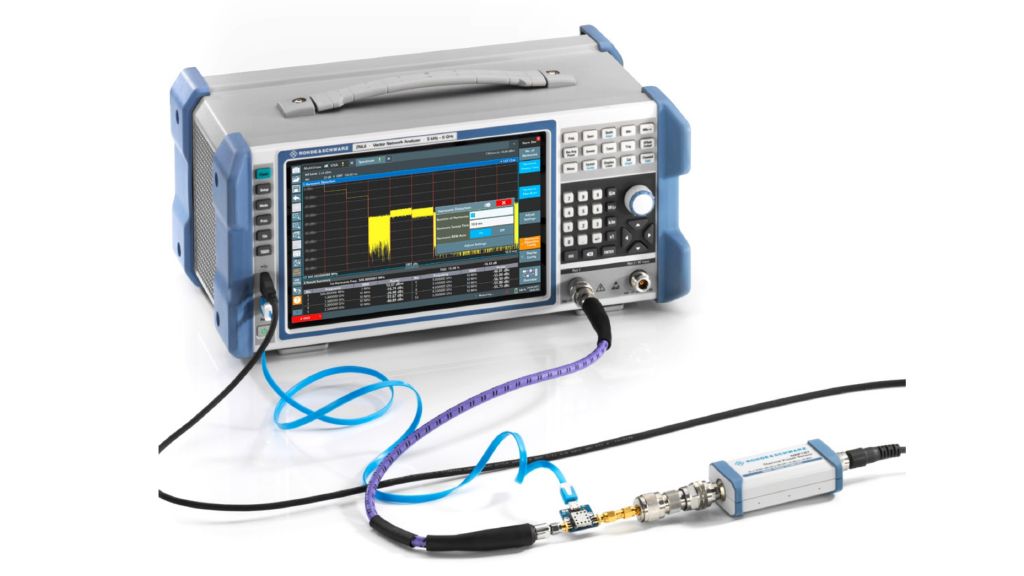
Measuring amplifier noise figure with R&S®ZNL (back), an R& S®FS-SNS18 (left) and an external pre-amplifier (right) powered by an R&S®HMP2030 programmable power supply (back right).
Open Lightbox

Your task

Amplifiers are one of the most common RF components because of their countless applications but are also one of the most complex devices under test (DUT) to measure. For a more complete characterization, an amplifier must be tested to determine linear S-parameters at a certain frequency or power and to measure parameters like harmonic distortion, third-order intercept (TOI), compression points and noise figure, all of which might not be possible with a traditional vector network analyzer. In fact, high-end equipment is often used to test such parameters and classic economy vector network analyzers (VNA) generally require complicated setups and time-consuming post-processing to make the data available in the correct format.

Switching between test stations to use a VNA and a spectrum analyzer is also feasible, however, it is not ideal when either time or space are limited, since the DUT and possibly the VNA, cables, a calibration kit or unit need to be moved from one place to another.

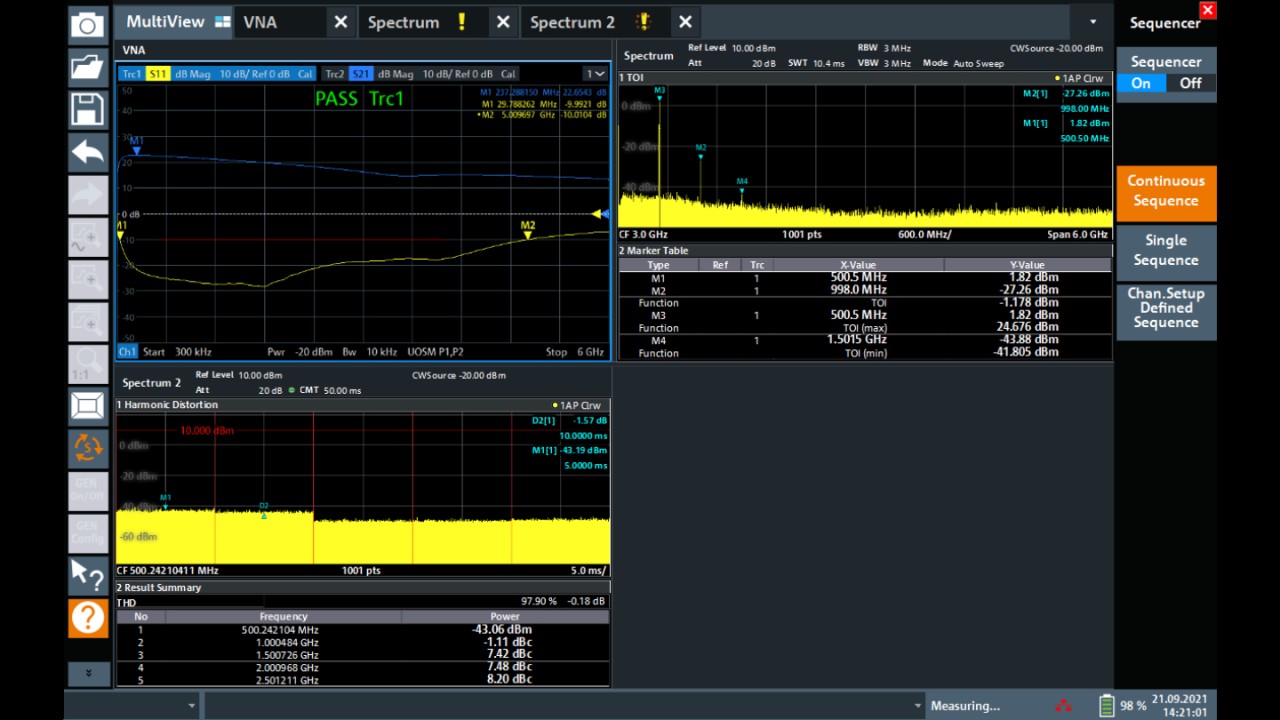
Data display with R&S®ZNL Multiview. This setup is automatically enabled when more than one mode is activated as an additional channel and can be accessed navigating to the corresponding tab on the top of the screen.
Open Lightbox

Rohde & Schwarz solution

The spectrum analyzer, signal generator, and noise figure measurement functions (enabled by the R&S®ZNLx-B1, R&S®ZNL-K14 and R&S®ZNL-K30 options) enable the R&S®ZNL to tackle all these problems, while completely eliminating the need to move the test setup between stations.

The R&S®ZNL is an economy multi-functional portable test device. It consists of a vector network analyzer, which can be upgraded with real spectrum analysis hardware (R&S®ZNLx-B1 option) and provides all the tools and performance needed for complete characterization of amplifiers in a single lightweight, compact box, which can also be equipped with a battery pack (R&S®FPL1-B31 option) for maximum mobility. Switching between network analysis and spectrum analysis modes is very easy and the R&S®ZNL Multiview provides users all the results from both modes in a single window for convenient data display and comprehensive reporting.

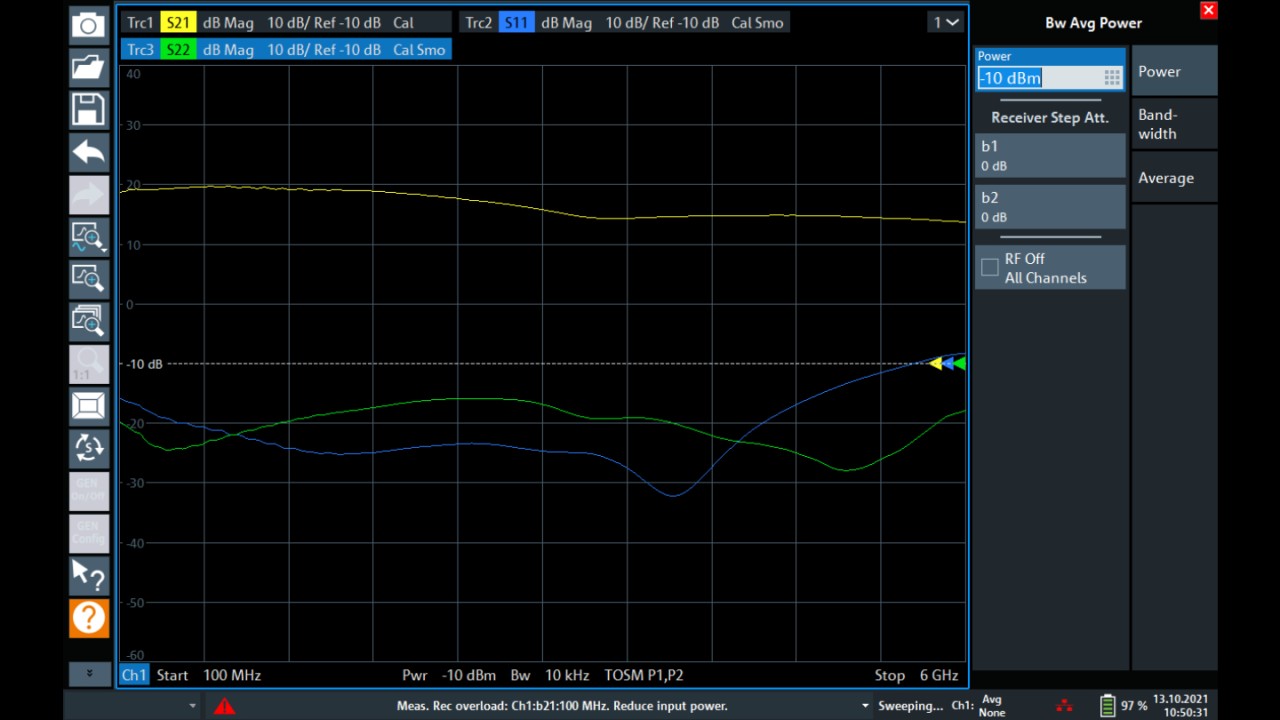
Measurement of S-parameters magnitude in network analysis mode for a measurement of an amplifier with a minimum of about 15 dB gain in the selected frequency range. A high VNA power output can overload the measurement receiver.
Open Lightbox

Application

Amplifier gain, input return loss (or VSWR) and output return loss can be accurately measured by the R&S®ZNL in vector network analysis mode: simply define the frequency range, the number of points needed for the sweep and adjust the required dynamic range and measurement speed by selecting the appropriate bandwidth for the measurement. Although the R&S®ZNL ports can withstand +27 dBm of input without damage, it is also important to not drive the amplifier under test and the R&S®ZNL internal receivers into compression (or destroy them). Therefore, the R&S®ZNL output power should be selected carefully and external attenuators considered where necessary. A system message informs the user when the measurement receiver is overloaded to ensure both measurement accuracy and equipment integrity. For additional protection, the R&S®ZNL can also have receiver step attenuators activated at port 1 (R&S®ZNLx-B31 option) and at port 2 (R&S®ZNLx-B32 option) and the power output can be set as low as –40 dBm (R&S®ZNLx-B22 option).

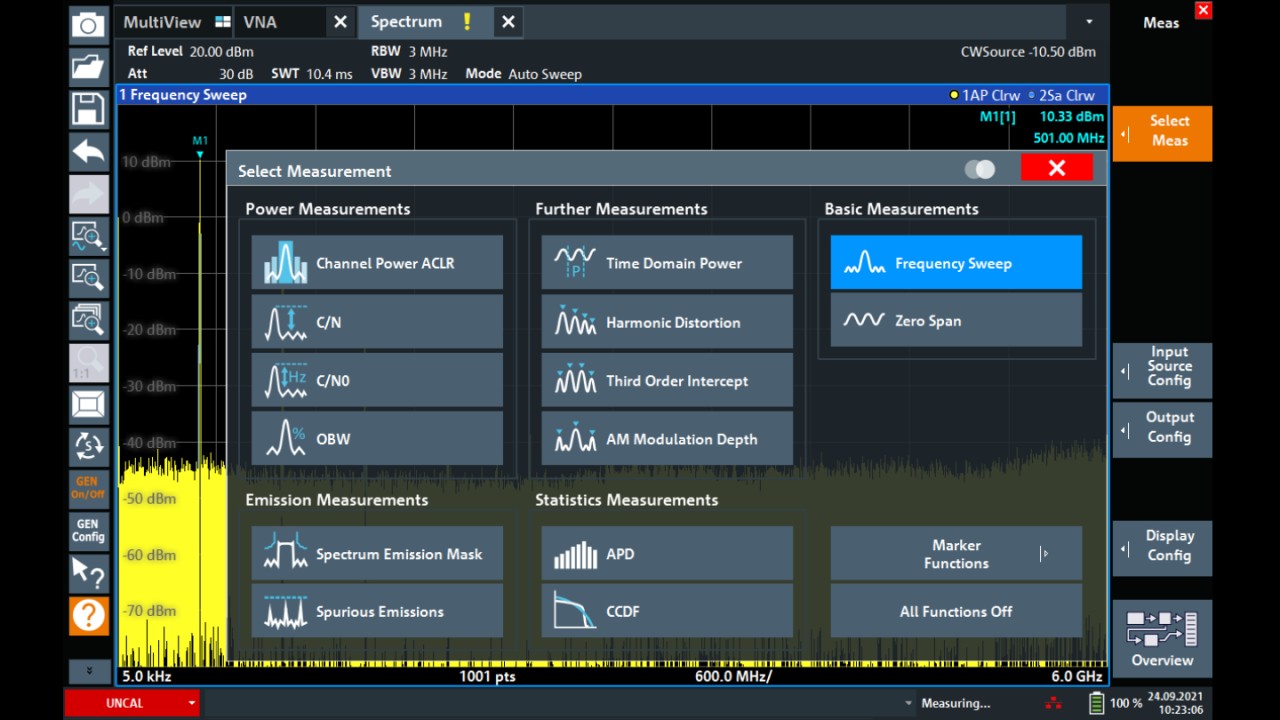
Choice of spectrum analyzer measurements. This menu is accessible by pushing the “Meas” button when in spectrum analysis mode.
Open Lightbox

Finally, a full two-port calibration is required before the test can be started. The calibration workflow in the menu guides users step by step through the process, starting from the selection of manual calibration kits or Rohde & Schwarz automatic calibration units, up to connection and measurement of standards.

The spectrum analysis mode can be accessed in the “Mode” menu, allowing several measurements to be performed and the convenient display of the relevant information. Nothing needs to be physically changed in the measurement setup.

The following measurements are recommended for amplifiers:

  • Zero span
  • Harmonic distortion
  • Third-order intercept

“Zero span” can measure amplifier compression points at a certain frequency when a stimulus is applied at the same frequency. Usually an external signal source is required, however the R&S®ZNL-K14 option eliminates the need for additional equipment with an independent continuous wave (CW) signal generator. The only necessary settings for the receiver are selecting the test frequency and an appropriate attenuation. The generator is then configured by entering the same test frequency and a signal level low enough to ensure that the DUT is not in compression.

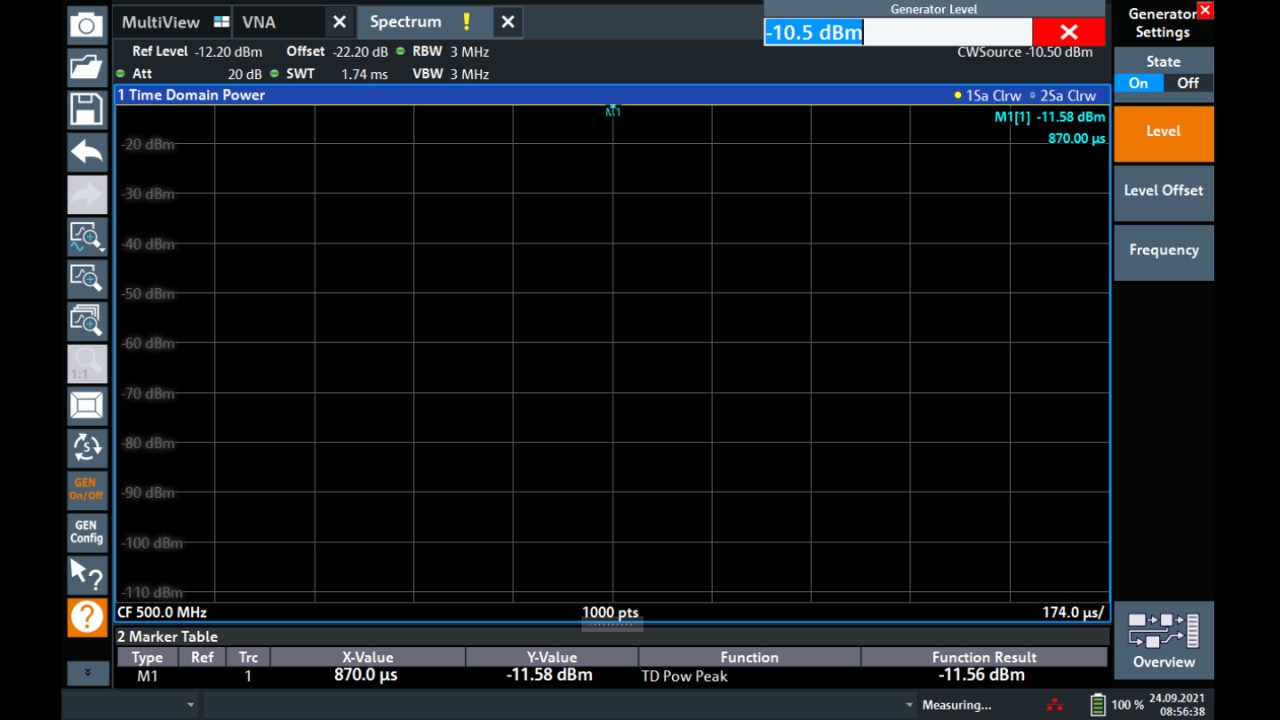
To identify the compression points easily, the reference offset can be tuned so that the generator level matches the amplifier output. When the CW source signal level is gradually increased, only the displayed quantity on the screen needs to be monitored and the user needs to observe when the displayed quantity falls a certain amount of dB below the selected input.

An amplifier “Zero Span” measurement at 500 MHz. With a CW input signal of –20 dBm, the reference offset is chosen so that the marker shows the same figure of the generator input (–20 dBm). Its signal level is then gradually increased, until the marker shows exactly 1 dB difference from the generator level, therefore it can be concluded that the –1 dB compression point is at –10.5 dBm input power.
Open Lightbox

The same measurements can be also performed in network analysis mode by normalizing the amplified transmitted CW signal when the DUT is in its linear region (before –1 dB compression) and by observing the deviation of the S21 curve from its zero, when the power of the signal fed to the amplifier input is gradually increased.

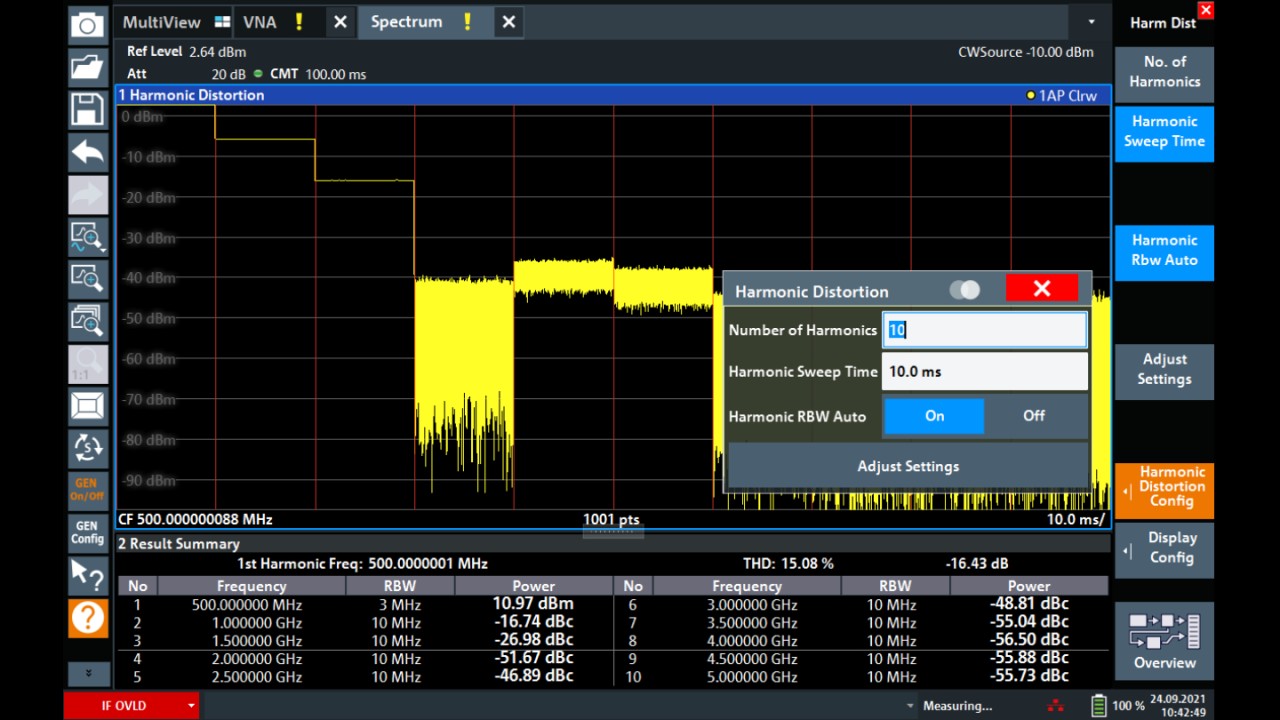
The spectrum analysis mode can also test DUT harmonic distortion performance. Selecting “harmonic distortion” from the spectrum analysis measurement menu is the only action required to display the relevant harmonics values for the selected carrier. The system will automatically show the data for the first ten harmonics as well as the total harmonic distortion (THD). Both the number of harmonics and the sweep time can be adjusted in the appropriate menu.

The power sensor NRP18T supports measurements from –35 dBm to +20 dBm from DC to 18 GHz.
Open Lightbox

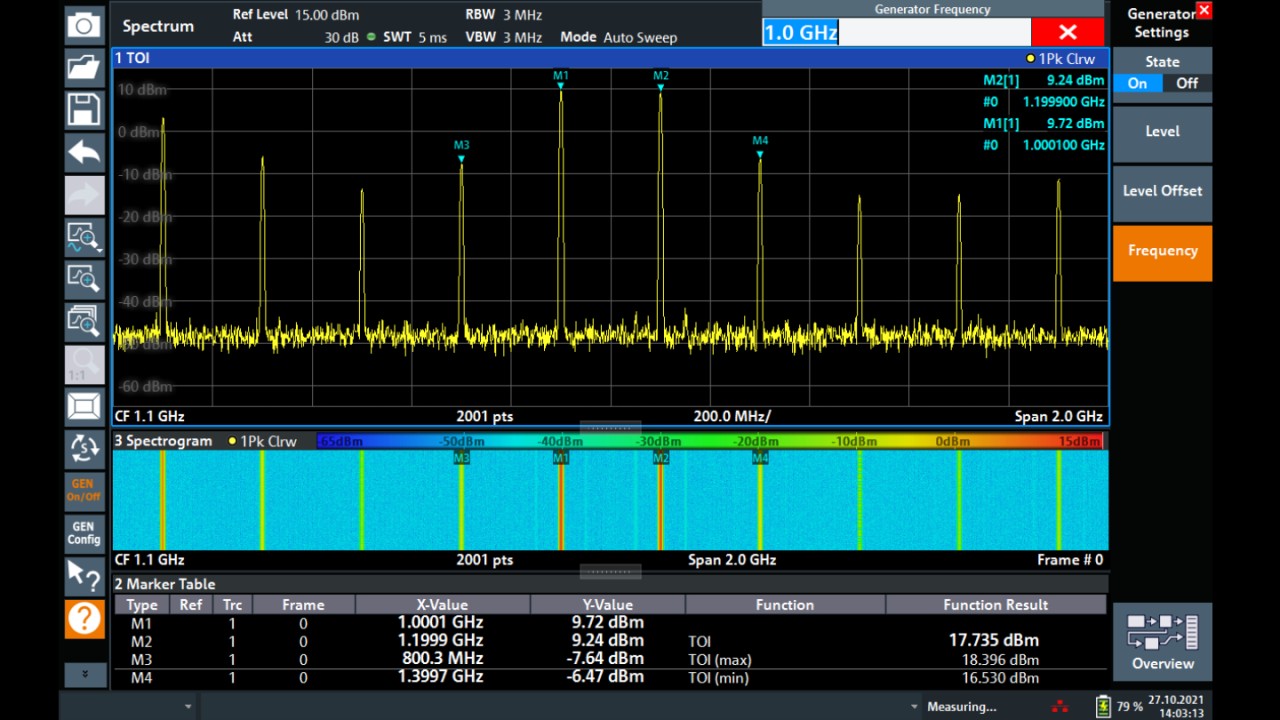
Intermodulation products can also be easily displayed by selecting “third-order intercept” from the measurement menu. However, this specific test requires the DUT input to be a two-tone signal, which can be obtained by merging two different CWs through an external combiner. One of signals can be provided from port 1 of the R&S®ZNL thanks to the R&S®ZNL-K14 option and the second should be provided by an external source, such as a signal generator or a second VNA. The setup can then provide information about the TOI of the amplifier.

The first ten harmonics of a 500 MHz carrier are conveniently shown with the “harmonic distortion” measurement. The result summary table lists their frequency and power level. The CW generator can be operated from the toolbar on the left of the screen.
Open Lightbox

Should an even larger measurement range or metrologyclass precision for power measurements be needed in spectrum analysis mode, the support for all R&S®NRP power sensors can be enabled with the R&S®FPL1-K9 option.

Since cables introduce losses, the R&S®ZNL signal power level at the DUT input can be checked to determine any losses. The difference between input and output can be analyzed in spectrum analysis mode by comparing the generator power level and the level displayed by the instrument when the cable leading to the DUT input is connected with port 2 or a power sensor instead. The generator offset can be used to fine tune the DUT input signal and compensate the cable losses. A similar assessment is possible in network analysis mode by analyzing the wave quantities a1 at port 1 and b1 at port 2.

Furthermore, the amplifier noise figure (NF) can be tested by selecting “Noise Figure” in the “Mode” menu of the R&S®ZNL. This measurement requires the R&S®ZNL-K30 option to be active and a noise source to be available along with an external pre-amplifier depending on the DUT requirements. The R&S®FPL1-B5 option can control a noise source directly with the R&S®ZNL. For simple and highly accurate NF measurements, an R&S®FS-SNS smart noise source is recommended, which is automatically identified by the system and does not require any user setting input.

The CW generator of a R&S®ZNL6 is been set to 1 GHz, and another CW signal at 1.2 GHz is provided from an external signal generator. The two tones are merged by a combiner and provided as input to the amplifier. The resulting spectrum is measured by the R&S®ZNL6 in “third-order intercept” measurement mode. A spectrogram can also be activated.
Open Lightbox

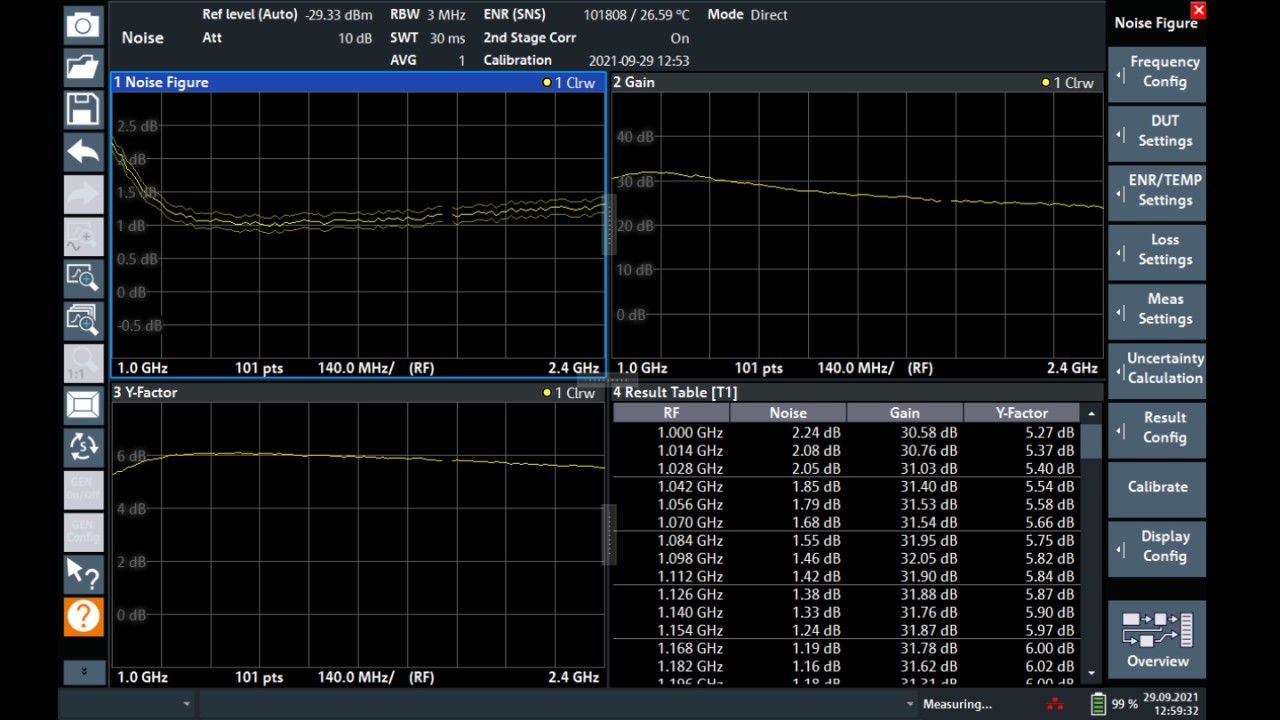
The measurement settings are also straightforward: users only need to select the frequency range and sweep points. If needed they can also control the measurement and settling times for each point. Characterizing an amplifier noise figure requires a different DUT connection. The system is calibrated by connecting the noise source to the second port of the R&S®ZNL with a pre-amplifier in between. Once the calibration step is completed, the DUT is inserted between the noise source and the pre-amplifier (see photo on page 1) and measured. All R&S®FS-SNS models can also support uncertainty calculations, which are conveniently displayed in the NF diagram. Activating and correctly displaying uncertainty is easy: the user activates the appropriate menu, ticks the checkbox for preamplifier use and enters its gain and NF.

An amplifier is measured with 101 points between 1 GHz and 2.4 GHz. NF, gain and Y factor are displayed in their related diagrams, and their value for each frequency measured are listed in the results table. The uncertainty calculation was easily set up thanks to the use of an R&S®FS-SNS18.
Open Lightbox

Summary

The R&S®ZNL vector network analyzer is a versatile instrument that can characterize the most challenging DUTs such as amplifiers without requiring lengthy setups or users to have extensive RF knowledge. The spectrum analysis options such as signal generator and noise figure measurement support ensure instrument flexibility and allow more hardware options such as a battery pack to make the R&S®ZNL the perfect all-rounder for every workplace, from labs to outdoors. R&S®NRP power sensors and R&S®FS-SNS smart noise sources can be used for even more precise and effortless measurements.