Written by Yunuen Wagner | July 31, 2019


For sure, you are aware of the huge frequency range’s impact. There are more sources of interference in the 700 MHz band than in the mmWave range. Also, the coverage area of the cells – and interferers – are directly related to the frequency: the higher the frequency, the smaller the radio signal. In FR2 (above 24.250 GHz), you´ll probably look for interference sources very close to the gNB, whereas in FR1 (below 7.225 GHz), the interference hunting process remains similar to previous technologies.
5G NR brings a new milestone to the field: it is the first time that TDD networks have a global footprint. However, identifying interference in a 5G NR TDD network might pose a challenge.
Where is the interference in 5G NR TDD?
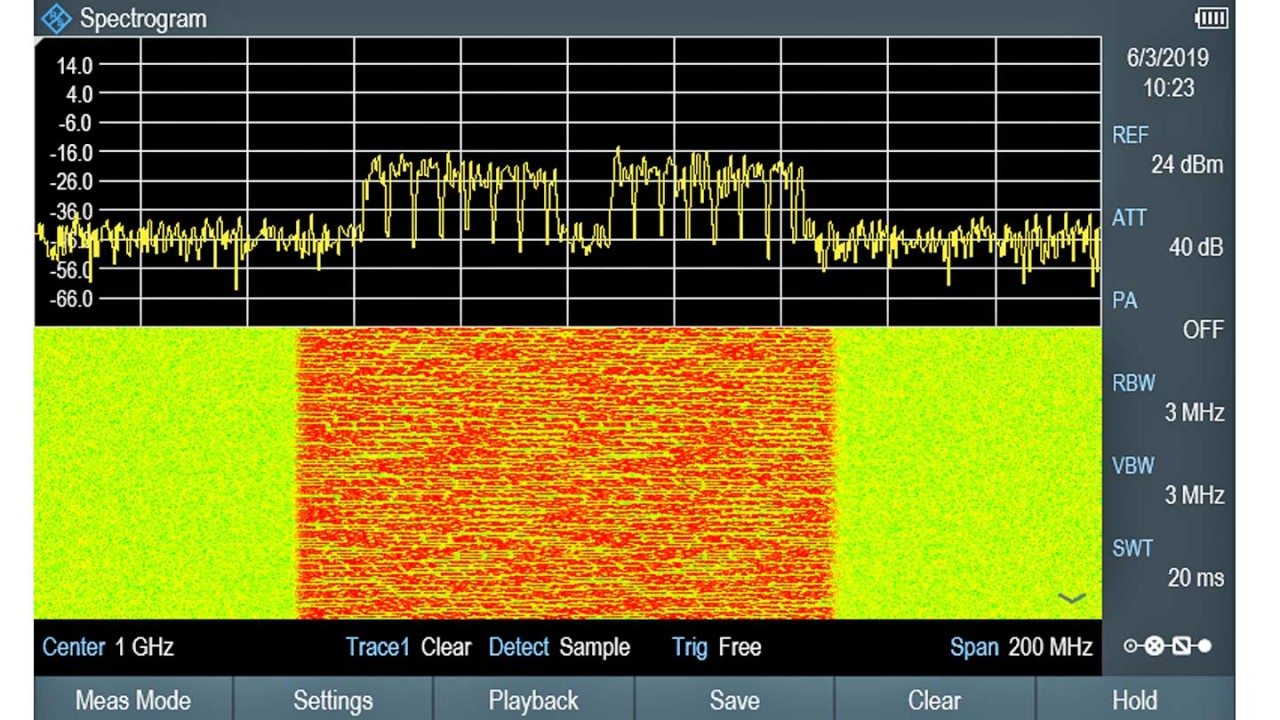
Consider for a second that the operations center reports a performance problem in a sector. You go out there with your spectrum analyzer to check for interference. As in FDD networks, the UL path in TDD networks is more susceptible to interference. So, you start there but get an initial measurement that looks like the image below.


Where is the interference? Unless the power level of the interference surpasses that of the gNB, it will be almost impossible to spot. There are two options to overcome this: first, switch off the BTS signal; second, somehow remove the DL signal from your instrument´s display.
Neither sounds viable, but switching off the BTS underscores the importance of addressing all interference before the deployment. Proper spectrum clearance in the early stages can avoid many headaches once the network is active (check out Peter´s post “Spectrum clearance: Prepare your 5G NR spectrum for deployment”).
Gated trigger to separate UL and DL slots
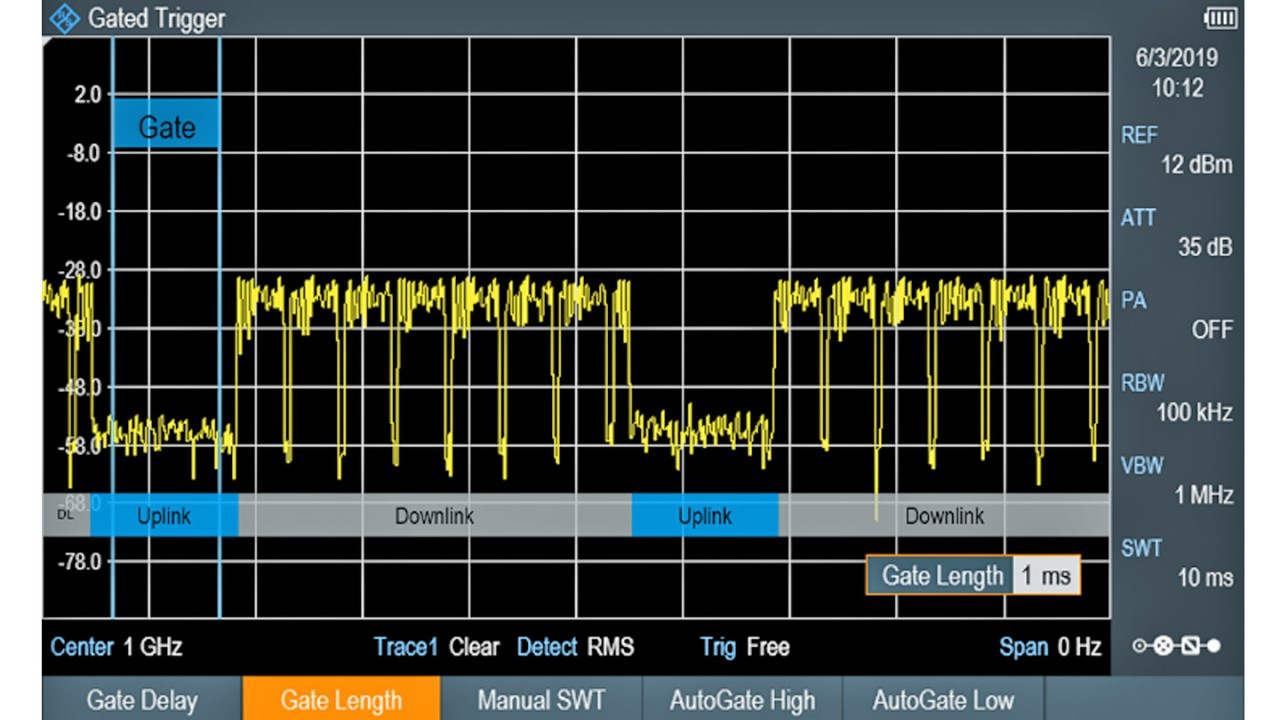
If the BTS cannot be switched off, you should definitely opt for removing the DL signal from the display. But how? Surprise, the process is very easy! The various R&S spectrum analyzers offer a gated trigger that enables you to separate the UL and DL slots. In a zero span-mode, you can easily configure a gate to match a UL slot, just like in the image below.


The gate is the reference for the instrument´s trigger: the analyzer measures only when the applied gate signal is active, allowing you to see the uplink signal exclusively. Does this apply to the mmWave range, too? Yes, the same procedure; the R&S®Spectrum Rider FPH covers up to 31 GHz.
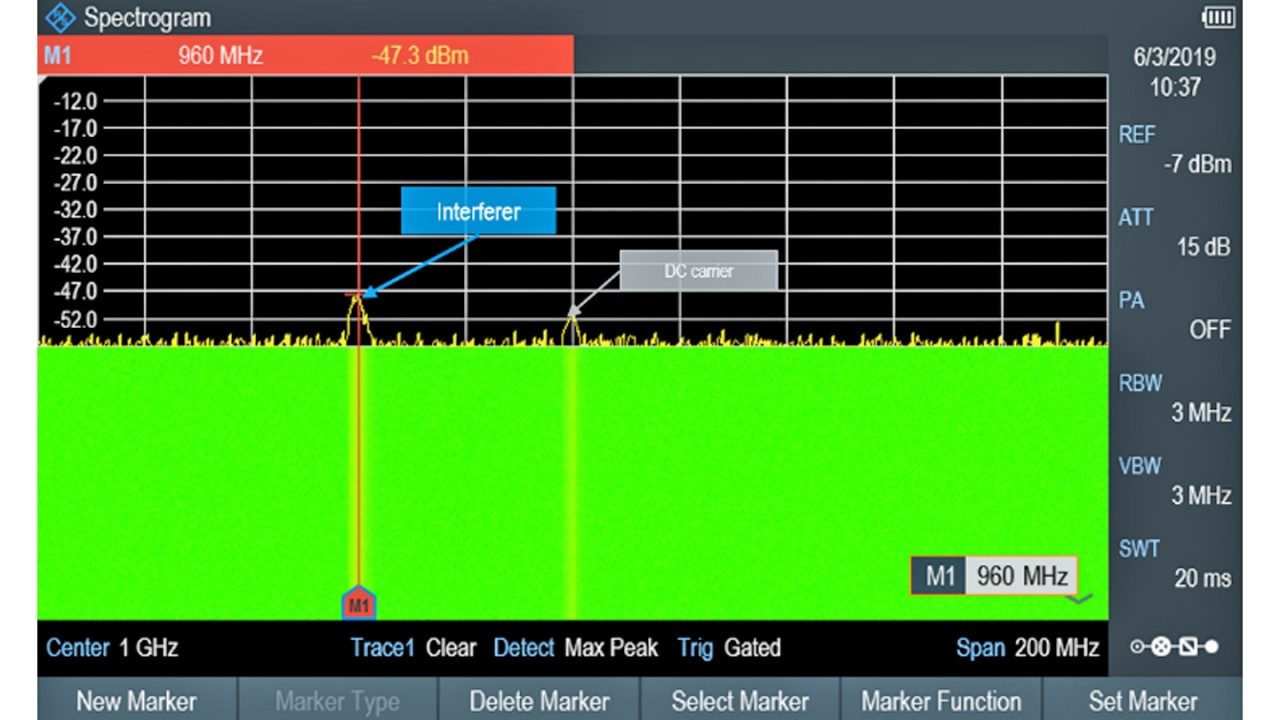
By applying the gated trigger to our test signal, back to the frequency domain, the small interference previously masked by the BTS signal is now clearly visible:


From this point, you can use common interference hunting tools: waterfall and long-time recording measurements to identify sporadic signals; use tone function and a directional antenna to locate the source.
If you have a spectrum analyzer with the gated trigger, give it a try. Otherwise, contact us, and we’ll assist you in coordinating an evaluation.


