Power supply rejection ratio measurement (PSRR)
With a Rohde & Schwarz oscilloscope

With a Rohde & Schwarz oscilloscope


Power supply design engineers often face the challenge of measuring the power supply rejection ratio or power supply ripple rejection (PSRR) of their design. The PSRR is an important parameter to indicate the power supply’s output stability. It provides information about the influence of input voltage variations on the stability of the output voltage.
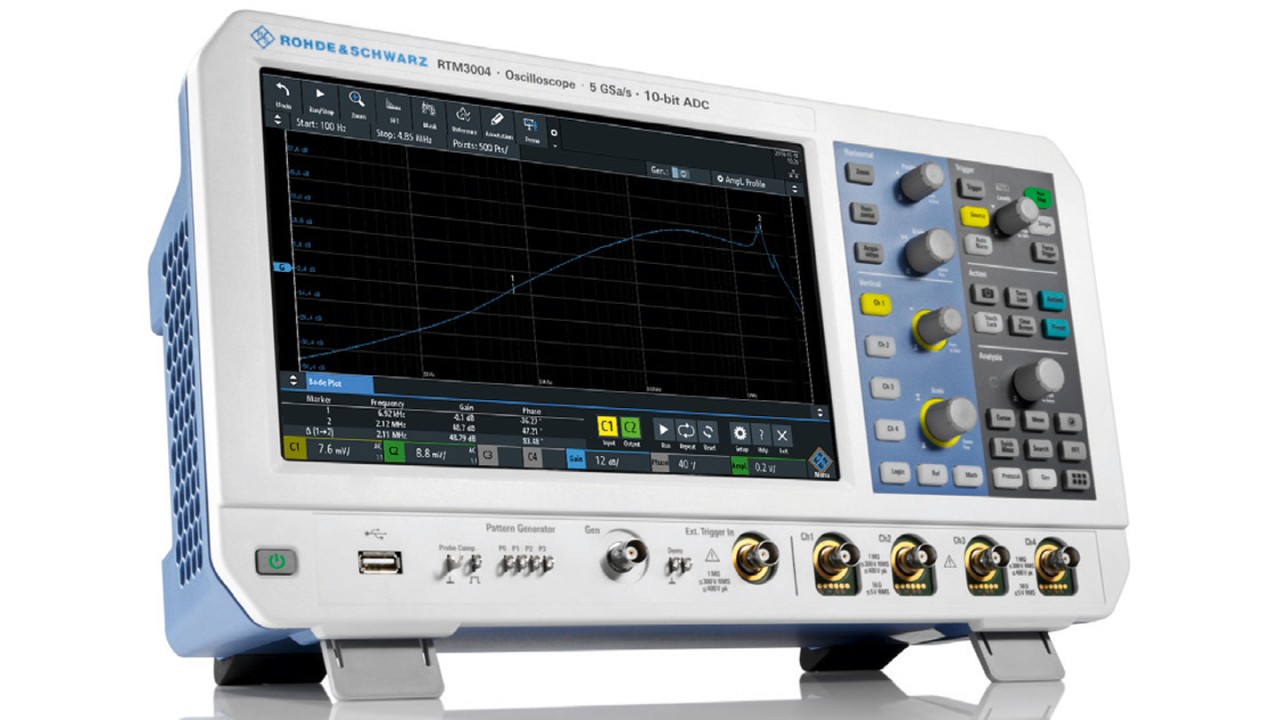
Easily and quickly analyze low frequency response on your oscilloscope with the R&S®RTx-K36 frequency response analysis (Bode plot) option. Characterize the frequency response of a variety of electronics, including passive filters and amplifier circuits. Measure the control loop response and power supply rejection ratio of switched-mode power supplies. The R&S®RTx-K36 option uses the oscilloscope’s built-in waveform generator to create stimulus signals ranging from 10 Hz to 25 MHz. Measuring the ratio of the stimulus signal and the output signal of the DUT at each test frequency, the oscilloscope plots gain logarithmically and phase linearly.
The R&S®RTx-K36 option allows you to measure the power supply rejection ratio and characterize the transition of the regulator system to the regulated output.


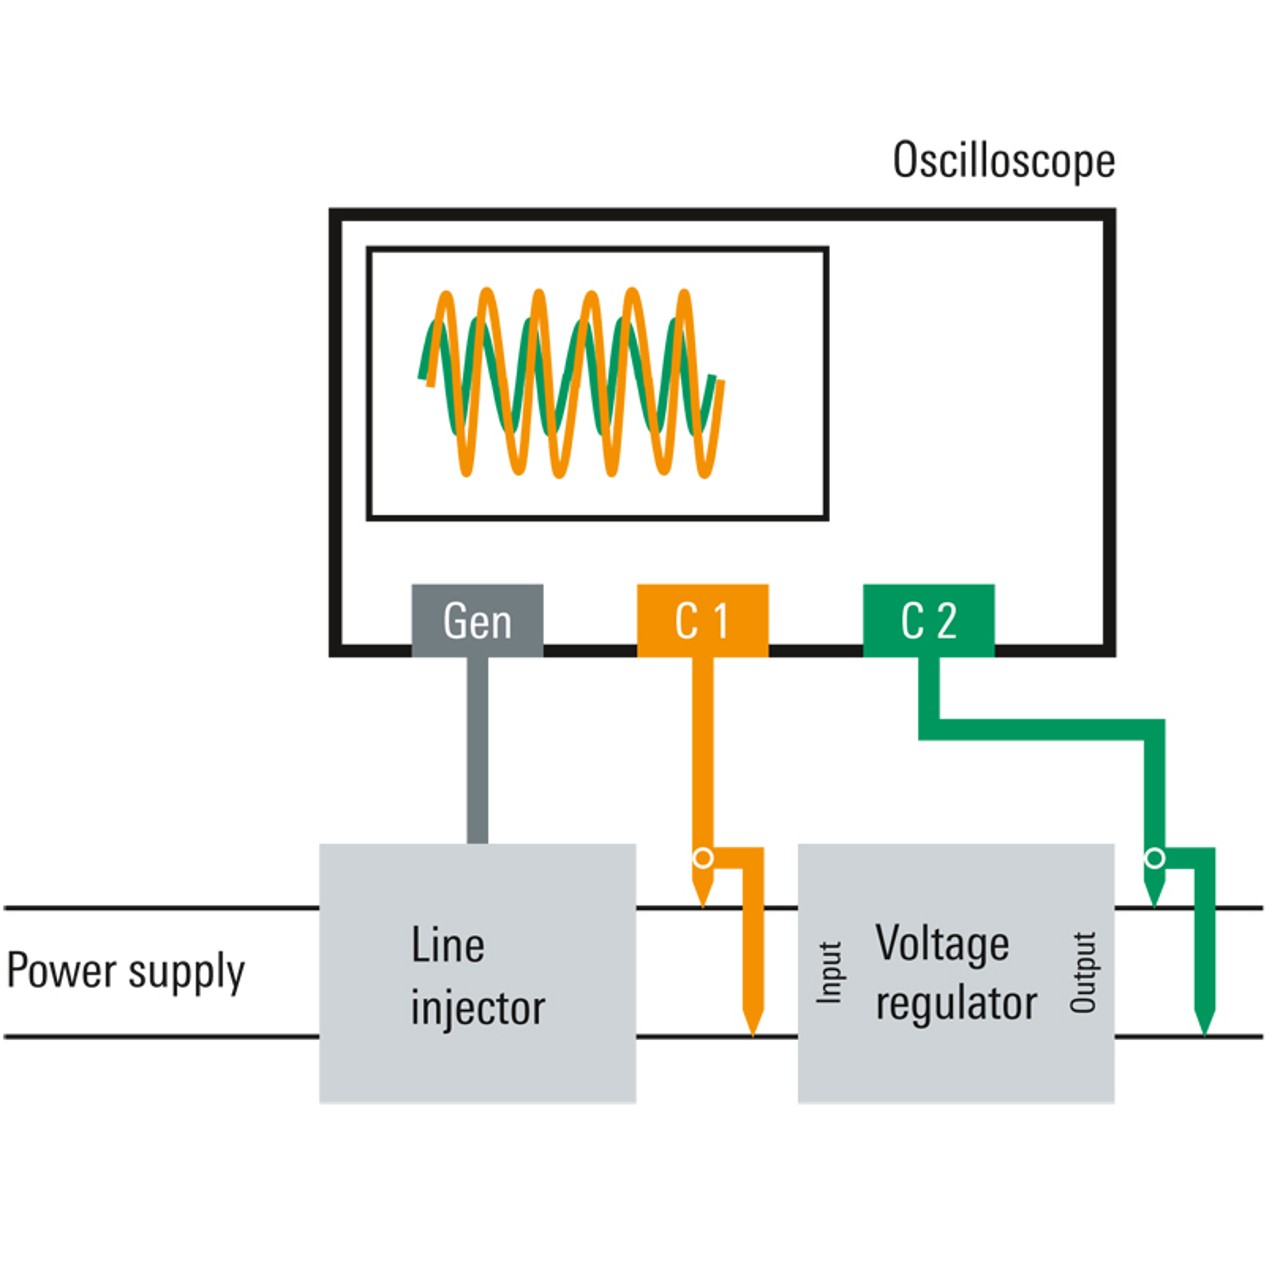
Measurement setup for PSRR
The PSRR can be measured by applying a sinusoidal ripple to the supply voltage and measuring the gain from the input to the output of the regulator.
A line injection transformer, such as Picotest’s J2120A, is required to ensure that the injected signal is isolated and does not induce any DC bias.


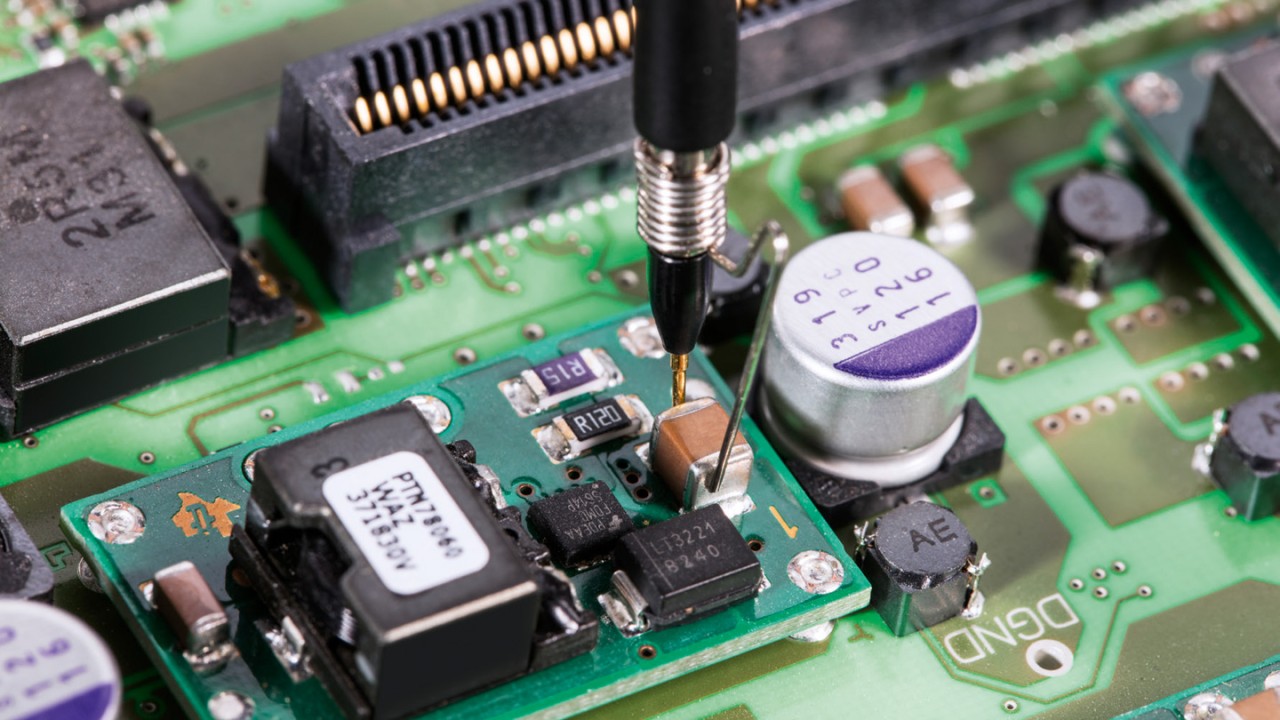
Using a ground spring will provide the best signal-to-noise ratio for your power supply rejection ratio measurement
Probing
Good probes are a prerequisite in order to perform good PSRR measurements. For example, the peak-to-peak amplitudes of the Vout signal can be very small due to the high rejection ratio of the DC-to-DC converter under test. This requires the use of probes with a higher dynamic range. Although most oscilloscopes usually come with 10:1 passive probes, the use of 1:1 passive probes on the output signal improves the dynamic range. Rohde & Schwarz recommends the R&S®RT-ZP1X 1:1 passive probes with 38 MHz bandwidth for this application.
Reducing the length of your probe’s ground connection minimizes ground loop inductance. The standard ground lead of your probe can sometimes act as an antenna and amplify unwanted switching noise. If there is a ground post near the Vin and Vout test points, you should not use a long ground lead. Use the ground spring of the R&S®RT-ZP1X probe to shorten the ground connection. This will provide a good low-noise ground for your measurement.
Device setup
After connecting the oscilloscope to the circuit under test, the measurement can be started easily:


PSRR measurement
Measurement results
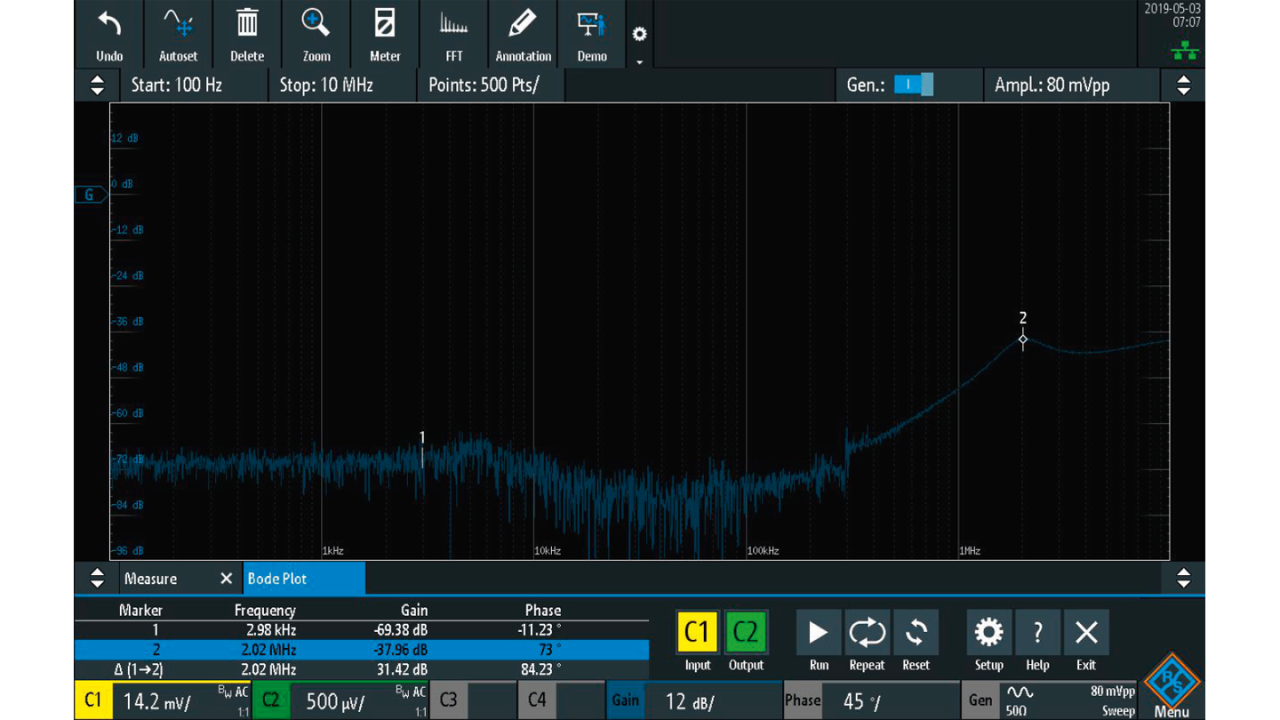
The curves displayed in the Bode plots represent the transition of the regulator system to the regulated output. The graph shows the gain over frequency. Drag markers to the desired positions directly on the plotted trace. A legend displays the coordinates of the markers.
View the results in a table. The measurement results table provides detailed information about each measured point (frequency, gain and phase shift). When using markers, the associated row of the result table is highlighted. For reporting, quickly save screenshots, table results or both to a USB device.
Oscilloscopes are the primary measurement tools used today by engineers to test and characterize their power supply designs. The R&S®RTx-K36 frequency response analysis (Bode plot) option provides a low-cost alternative to low frequency network analyzers or dedicated standalone frequency analyzers.