Written by Johanna Sochos | April 30, 2020
More specifically, in part 2 of this series, we will answer the following questions:
- Can we transfer a standard delay measurement method onto a load-depending, time-invariant real-field mobile network?
- How is it possible in practice to measure the interactivity of a network?
- What should a realistic traffic pattern look like?
- And, how can we define a QoE model for an example application like real-time eGaming that requires high network interactivity?
Let’s start with the interactivity test concept.
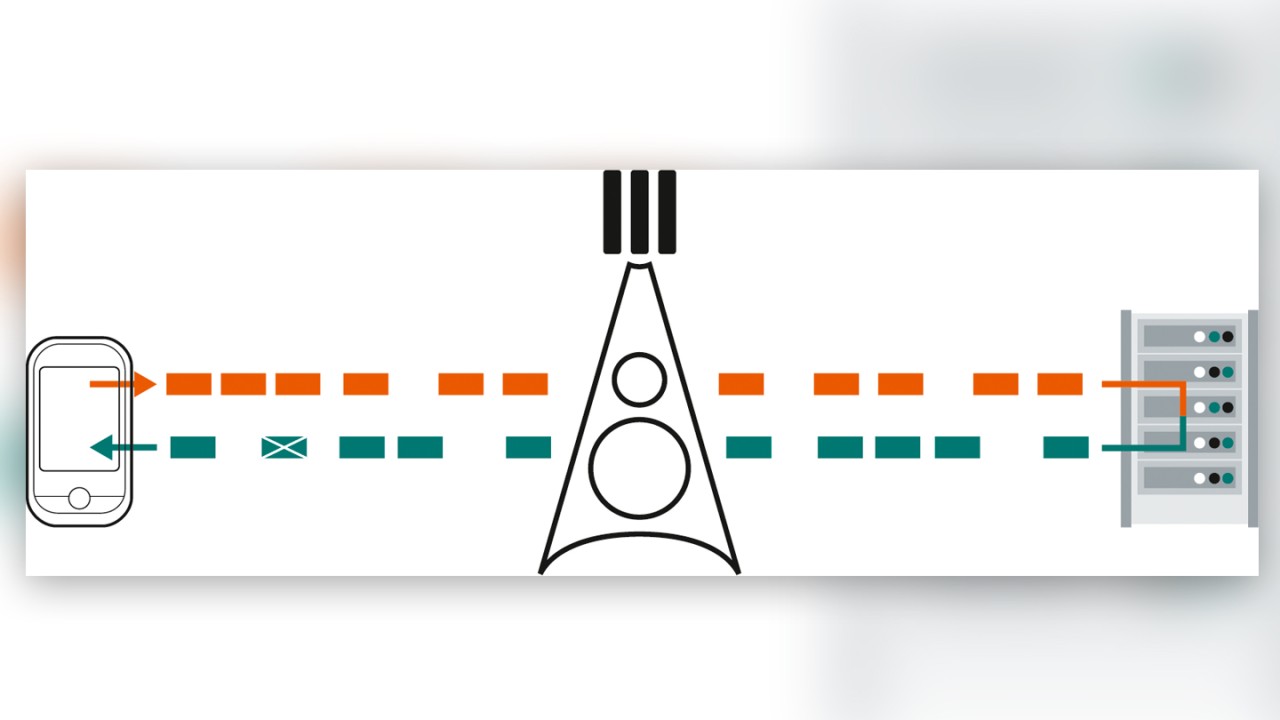
To measure the bit rate, latency, and continuity at the same time, we developed and implemented an integrative test concept: the interactivity test. The idea is that the user equipment (UE) acts as a client that sends a stream of packets to an active remote station, for example, a server or partner UE that acts as the responder and reflects the packets to the UE.
The most important aspect of deriving realistic measurement results, such as in real applications, is the emulation of traffic and load patterns during the measurement as they would occur in real applications. This leads to results that will reliably resemble the real QoS a user of the application would experience.
It is not sufficient to just send a few packets to measure latency and to rate the transmission quality. The implemented test case is therefore designed to emulate real traffic patterns and to create data streams like in real-time applications. On the client-side, the sent traffic pattern – packet size and frequency – is set, and thus the data rate is controlled.
The packet sending rate is high enough to create a quasi-continuous packet flow. Since the client controls the packet payload and the sending and receiving time, it is possible to measure:
- Data rates of TX and RX
- Round-trip latency of the packets
- Packet delay variation (jitter) as the latency variation over time
- Packet loss rate
- Packet corruption rate (roadmap feature)
Interactivity test protocols
The interactivity test’s data exchange is based on the User Datagram Protocol (UDP). Not only is UDP the main protocol for real-time applications, it is also the protocol that comes closest to the physical layer, and it avoids any additional, uncontrollable traffic by acknowledgments and retransmissions.
The higher layer protocol for the data flow between the client and server is based on TWAMP, the two-way active measurement protocol. TWAMP is a state-of-the-art protocol specified by the standards organization Internet Engineering Task Force (IETF). It is targeted for implementation in components such as firewalls, routers, and IP gateways for performance measurements.
The client on the UE is implemented under Android native to minimize OS influence and to achieve a high measurement accuracy for real ultra-reliable low latency communications (URLLC) measurements.
There is a valuable difference between the interactivity test and ping tests. A simple ping test uses a separate protocol and is designed to verify the availability of an IP device in the network. It creates almost no load, and the transport system might be protocol-aware.
The interactivity test generates traffic patterns that are typical to real use cases. Transmitting a heavy flow of UDP packets in high frequency in the simulation of a real use case requires a different network than sending a series of pings, and it will draw a more realistic picture of latency, latency jitter, and packet losses.
Real-time eGaming traffic pattern example
As we want to apply a realistic network traffic load, we have to define individual patterns as archetypes for different applications. In addition, we can assume that applications with real-time interaction include some kind of jitter buffer that will drop information after a certain waiting period. Therefore, the basic control parameters for such a traffic pattern are:
- Packet rate
- Packet size
- Packet delay budget (if exceeded, the packet counts as lost)
- Test duration
These parameters do not necessarily remain constant throughout a test; they can also emulate bursty shapes as are typical for applications with temporarily highly interactive phases.
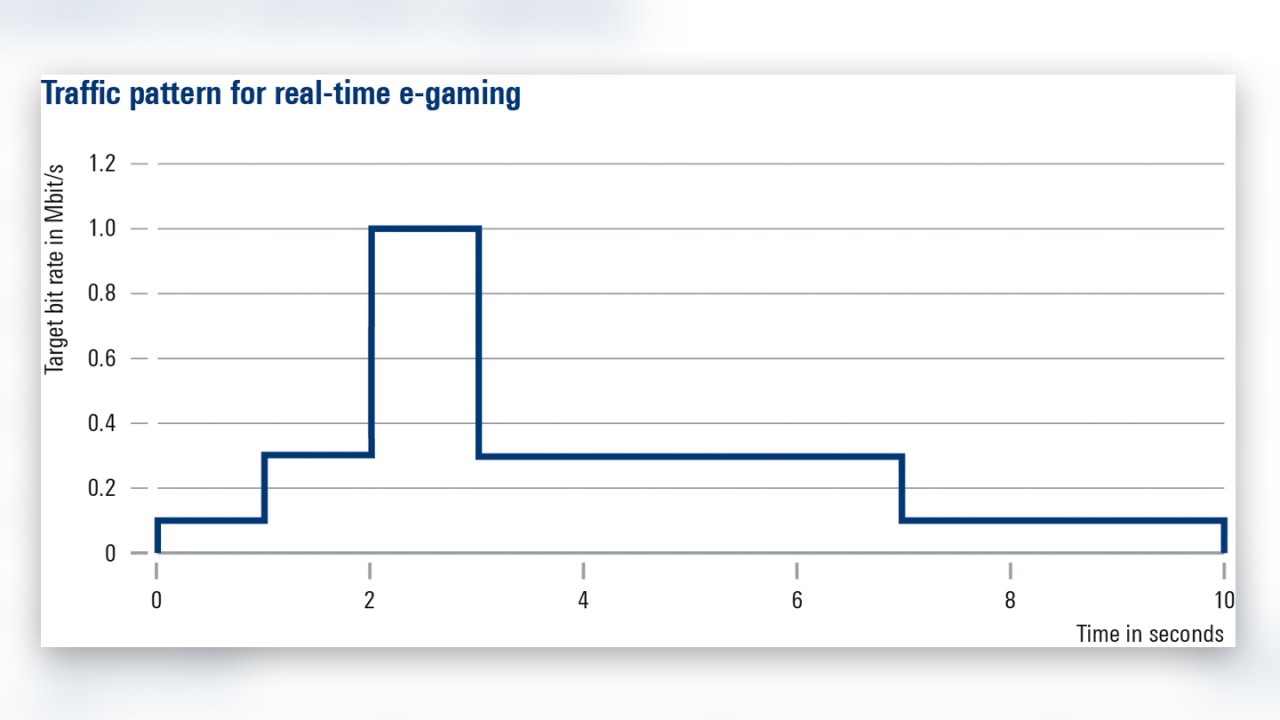
In our case study about the typical traffic patterns created by today’s most demanding real-time multiplayer online games from a network’s point of view, we found that:
- The mobile traffic is not constant but depends on the phase of a game
- In normal phases, the data rate is around 100 Kbit/s
- In highly interactive phases, with more than 100 simultaneous players, the data rate increases to around 300 Kbit/s
- The peak data rate measured was around 1000 Kbit/s in a short burst
These findings lead us to define the following traffic pattern as a challenging but realistic scenario for real-time eGaming applications:
Interactivity test results
With the round-trip set up and the realistic traffic pattern applied, the interactivity test measures individual latencies of several thousand packets per test. This leads to a rich set of technical KPIs and additionally serves as input for a QoE model tailored to the given application. The technical KPIs of the interactivity test are:
- Latency: The two-way latency is measured as the median round-trip time (RTT) of all individual RTTs of the packets that successfully arrived back at the session sender in time. Additionally, the 10th percentile of the RTTs is calculated, representing the best case RTT of the current channel.
- Packet delay variation (PDV): In line with RFC 5481, the packet delay variation of an individual packet is defined as the offset from the minimum measured individual packet delay. The median of this distribution is a good measure of delay variation.
- Packet error rate (PER): The packet error rate is derived from the number of all packets that were not available to the hypothetical application at the time needed, including:
- Packets that could not even leave the client device due to uplink congestion
- Packets that were lost on the way
- Packets that were too slow and arrived after the given packet delay budget; they are discarded and count as lost
- Packets where the payload is corrupted (roadmap feature)
QoE model – interactivity score
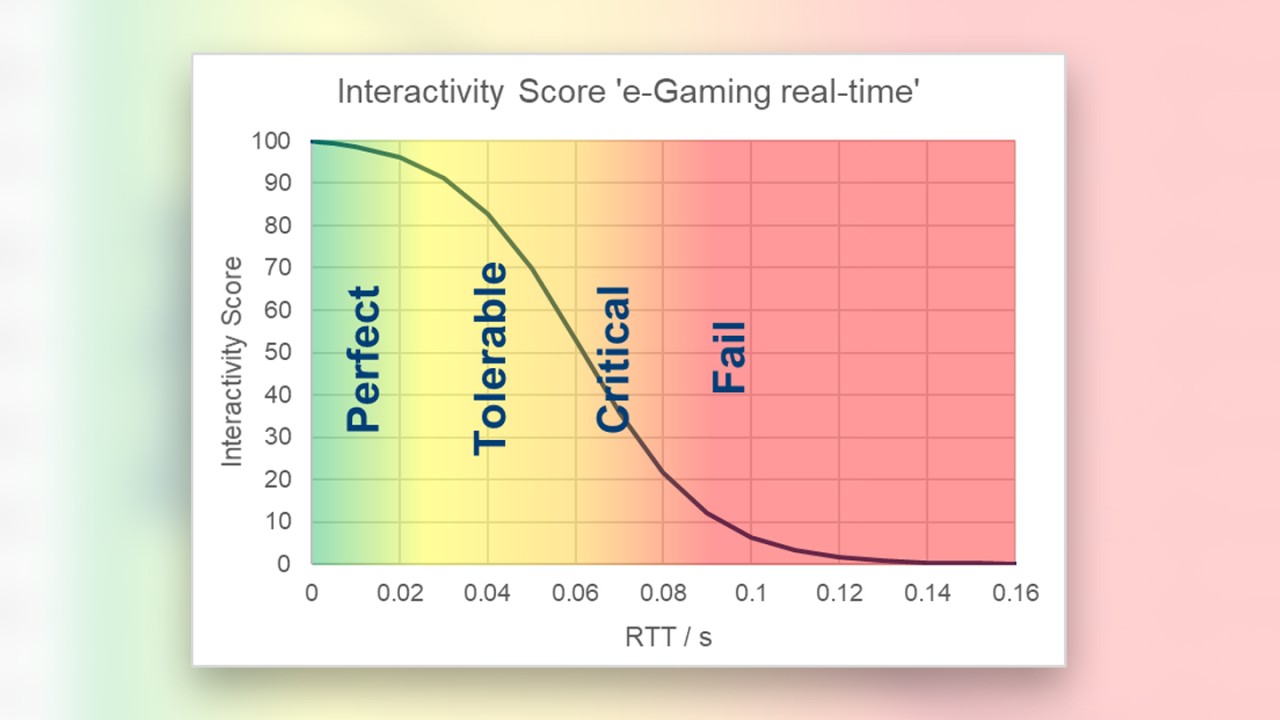
To emulate real applications, a generic QoE model is used per application class. Each QoE model creates a “synthetic MOS” based on QoS and technical KPIs called the interactivity score. These technical measurements are the same for all types of applications, except for the underlying traffic pattern.
The first step is to provide a QoE model based on latency, packet delay variation, and packet error rate that targets today’s real-time eGaming applications.
Interactivity Score = ScoreLATENCY × ScorePDV × ScorePER × 100%
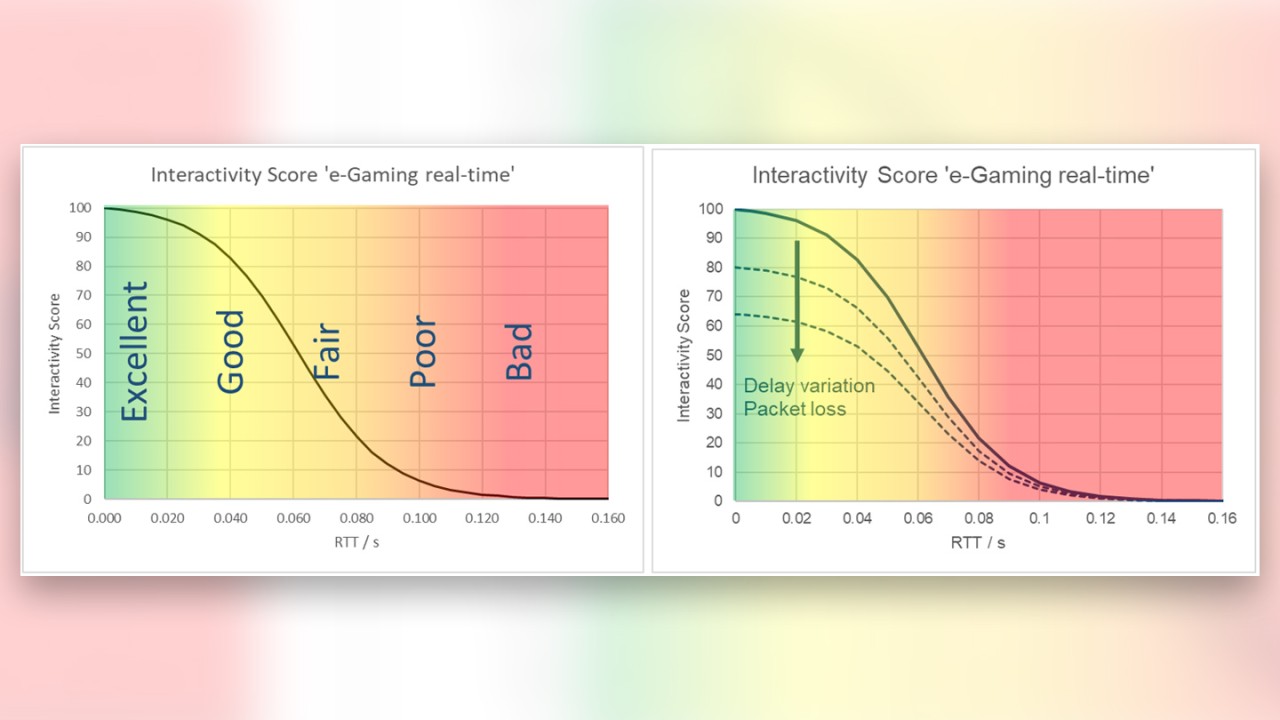
The first term of the score is an s-shaped logistic function that maps the individual round-trip time measurements per packet to a pseudo perceptive scale (see the image on the left below). The colors indicate the quality of the service that can be expected for a given latency.
The remaining two terms depend on packet delay variation and packet error rate, whereby higher values lead to a downward shift of the s-curve (see the image on the right below).
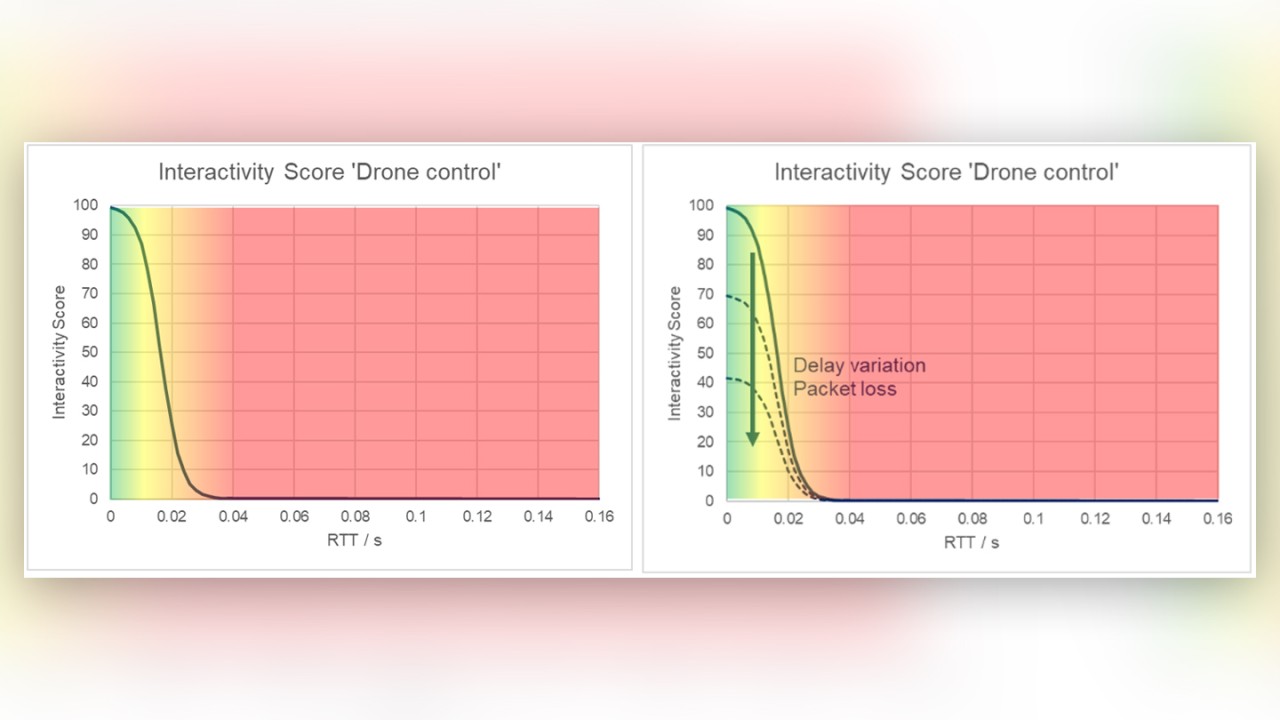
The model can be easily adapted for the different requirements and expectations for application types other than eGaming. For example, the s-shaped model for the latency value in the interactivity score for drone control will be much steeper:
The interactivity score is a generic and scalable model that is also applicable to non-human use cases such as car-to-car communication or the production and manufacturing industry. The reason being that in machine communication, we do not have a hard threshold between pass or fail either.
There is a tolerance region where, for example, the production failure rate of an item increases but remains at acceptable levels, and there are saturation regions for good and bad conditions. Therefore, the non-human quality rating is quite similar to rating human QoE.
Measurement scenarios
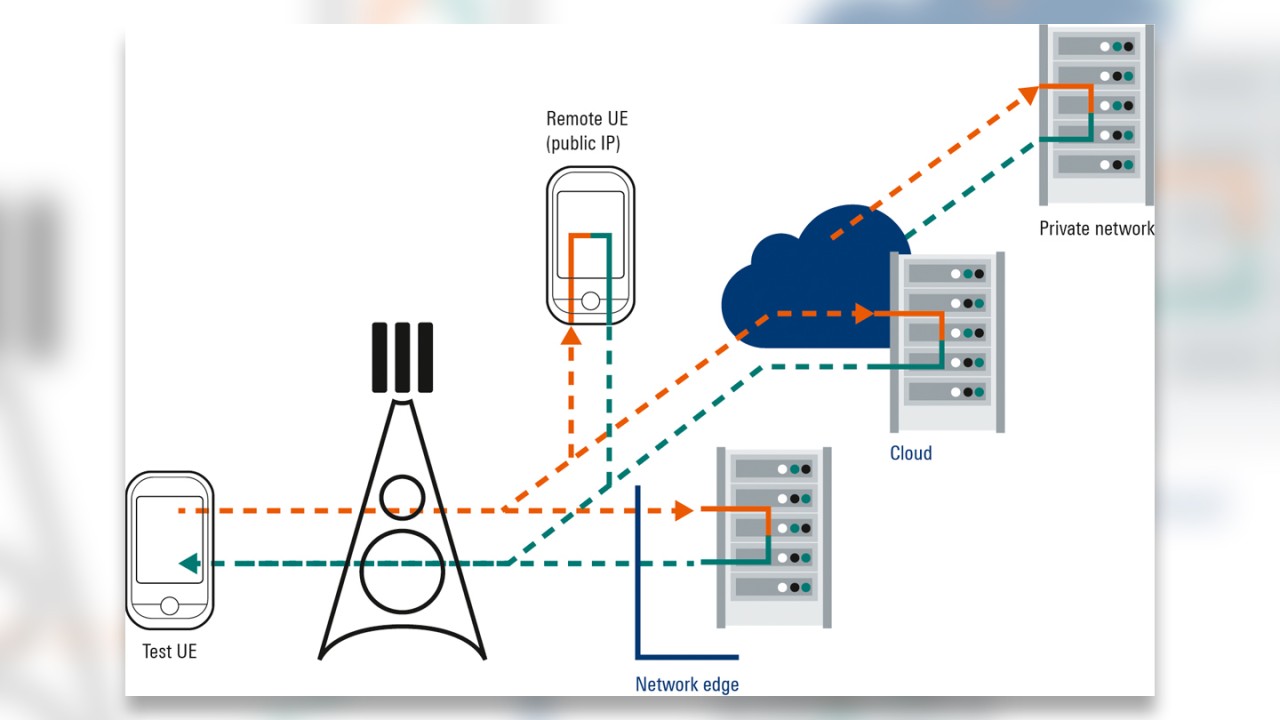
Before setting up an actual test, there is one more topic to consider. What connection should be measured? The test offers high flexibility regarding the position of the responding server. Rohde & Schwarz offers a lightweight Linux VM that can be installed anywhere in the cloud, a private network, or even on another smartphone as long as it has a public IP address. Additionally, the TWAMP protocol is supported by selected infrastructure equipment, potentially located directly at the network edge.
The decision about the server’s position depends on the use case of interest. For eGaming, the server should typically be located somewhere in the cloud. For a technical measurement of the radio interface, e.g., targeting ultra-low latencies in 5G, the server should be located as close to the network edge as possible.
Summary
Our concept for measuring the interactivity of a network is based on synthetically creating a realistic archetype traffic pattern per application type without the need to run a specific application for the test. This way, the test is much more generic, and we have access to the whole depth of information from the overall QoS to the per-packet level.
All needed technical KPIs can be measured at the same time and serve as input into our expert QoE models. The setup of the measurement scenario is very flexible because of the underlying TWAMP protocol. The results of the test are dependable and comparable.
Read more about interactivity test in part 1 - 8 of this series and download our white paper "Interactivity test":
Interactivity test: QoS/QoE measurements in 5G (part 1)
Interactivity test: Examples from real 5G networks (part 3)
Interactivity test: Distance to server impact on latency and jitter (part 4)
Interactivity test: Impact of changing network conditions (part 5)
Interactivity test: Packet delay variation and packet loss (part 6)
Interactivity test: Dependency of packet latency on data rate (part7)


