Measure noise figure above 110 GHz

Rohde & Schwarz signal and spectrum analyzers equipped with the R&S®FSx-K30 option form the basis of a solution to accurately measure the noise figure in the millimeterwave frequency range using the Y-factor method.

Your task

With recent enhancements in semiconductor technology, the microwave frequency range beyond 110 GHz becomes more and more attractive, especially for millimeterwave radar and imaging applications. However, usually the signal-to-noise ratio in a receiver becomes worse at higher frequency ranges. When developing millimeterwave applications, it is therefore crucial to measure the noise figure of LNAs (low noise amplifiers) or the entire receive path in order to increase sensitivity.

The LNA’s noise figure and gain define the overall achievable signal-to-noise ratio. Both parameters need to be measured in order to design the system properly and improve the resolution of the radar and microwave imaging applications or to enhance data throughput for communications applications.

T&M solution

A Rohde&Schwarz signal and spectrum analyzer, such as the R&S®FSW, equipped with the R&S®FSx-K30 noise figure measurements option is ideal to accurately measure and analyze noise figure and gain even in the millimeterwave range. An external harmonic mixer such as the R&S®FS‑Z170 extends the analyzer’s frequency range up to 170 GHz

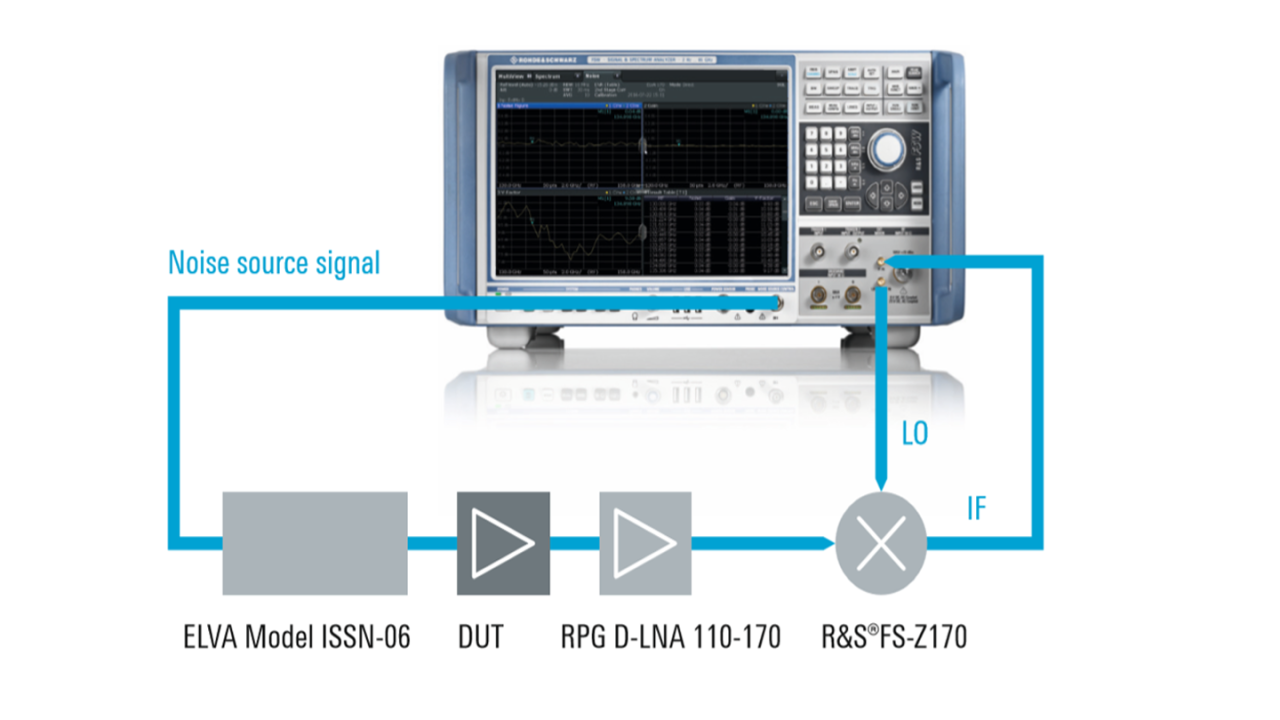
Noise figure and gain are commonly measured with the Y‑factor method. This technique utilizes a noise source, such as the noise diode (model ISSN-06) from ELVA with a frequency range from 110 GHz to 170 GHz, to provide an excessive noise ratio (ENR) to the device under test. To increase the analyzer’s sensitivity and achieve reproducible and reliable results, an additional low noise preamplifier such as the RPG D-LNA 110-170 in front of the mixer is recommended (RPG is a Rohde&Schwarz company).

Measure noise figure above 110 GHz
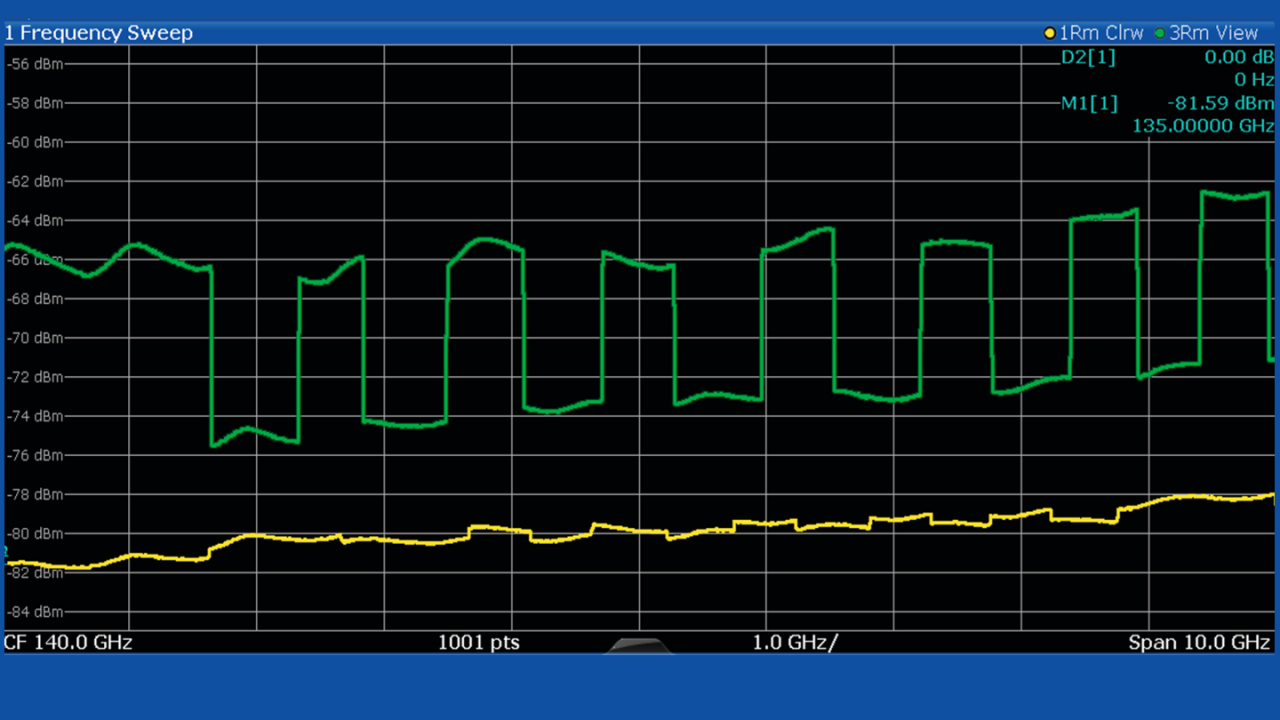
A preamplifier (green) improves the Y factor by more than 10 times compared to the achievable Y factor without a preamplifier (yellow) at 140 GHz center frequency.
Open Lightbox

The R&S®FSx-K30 fully controls the test setup. It switches the ENR of the noise source on and off during the measurement sweep and displays the calculated noise figure and gain results in various graphs and tables. The difference between the noise floors with the noise diode switched on/off is the Y factor. Without a preamplifier, the achievable Y factor at 140 GHz is only about 0.5 dB. Applying the preamplifier increases the Y factor by more than 10 times to about 7 dB, which has a crucial influence on the measurement accuracy.

Excellent performance at millimeterwave frequencies

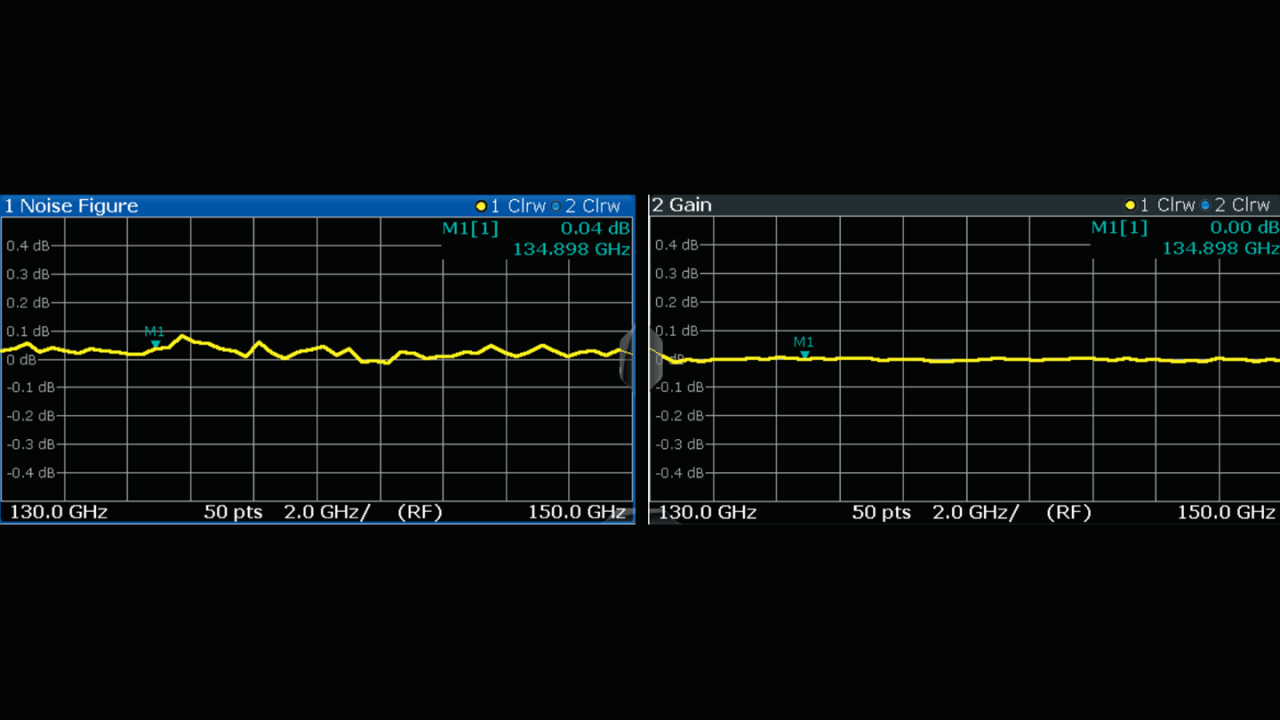
The R&S®FSW signal and spectrum analyzer offers excellent performance even at millimeterwave frequencies. A preamplifier increases the Y factor sufficiently to compensate for the analyzer’s small statistical error for noise figure and gain in the range of only 0.1 dB. This makes it possible to perform reproducible measurement results even above 110 GHz.

The VSWR of the test setup adds an additional systematic error to the test results that needs to be calculated. The R&S®FSx-K30 option already includes an uncertainty calculator for noise figure and gain measurements. Typical values for VSWR, ENR uncertainty and gain of the used components can be entered. This leads to a calculated systematic error of about 0.5 dB for the described setup. Some additional attenuators or filters might be needed to reduce the systematic error.

Summary

A Rohde&Schwarz signal and spectrum analyzer equipped with the R&S®FSx-K30 option forms the basis of a solution to accurately measure noise figure and gain in the millimeterwave range using the Y-factor method. The integrated uncertainty calculator is a powerful tool that takes into account all setup parameters such as VSWR, ENR uncertainty and additional attenuators and filters for error calculations.

Replacing the DUT with a through connection with 0 dB gain and 0 dB noise figure verifies the small 0.1 dB statistical error of the R&S®FSW for noise figure and gain – after second stage correction to subtract the influence of the analyzer.

Typical setup for noise figure measurements based on the Y-factor method: The R&S®FSW equipped with the R&S®FSx-K30 option in a test setup with an external harmonic mixer, a low noise preamplifier and a noise source enables accurate noise figure and gain measurements, including error calculation above 110 GHz.