Written by Silvio Borer | May 27, 2024

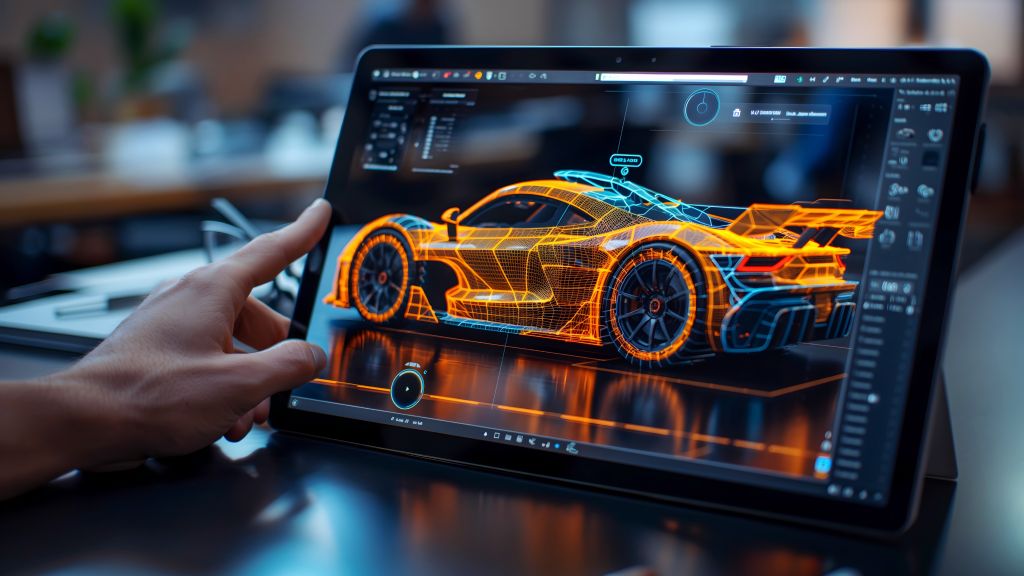
Extended reality (XR) including augmented reality (AR) and virtual reality (VR) might change how we interact with friends, enjoy entertainment and experience new products and places.
Many have experienced XR on a smartphone, where apps are downloaded and a virtual environment completely created without connecting to the internet. More advanced online applications use scenarios from a server, and render static content on the device. New standardized methods for streaming volumetric data are being developed for dynamic content and the initial standards have already been set. The new methods stream a virtual 3D scene instead of a 2D image at every time point result in greater complexity and higher bandwidth demands on transmission channels and a higher computational load on end user devices.
Another approach renders the view port (the portion of the scene the user is currently viewing) of static and dynamic content on a cloud server, data center or edge server and streams traditional video stream to the user device. This approach (even with higher bandwidth for static content) uses established and widespread technologies to encode, transmit, and decode the video stream. The approach reduces the computational load on the play back device, uses existing hardware for video decoding and reduces energy consumption, which is very important for mobile devices. The virtual experience can be run on a broad set of devices without the need of software installation.
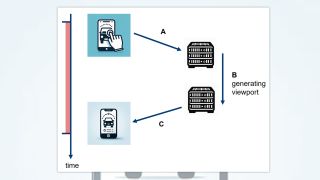
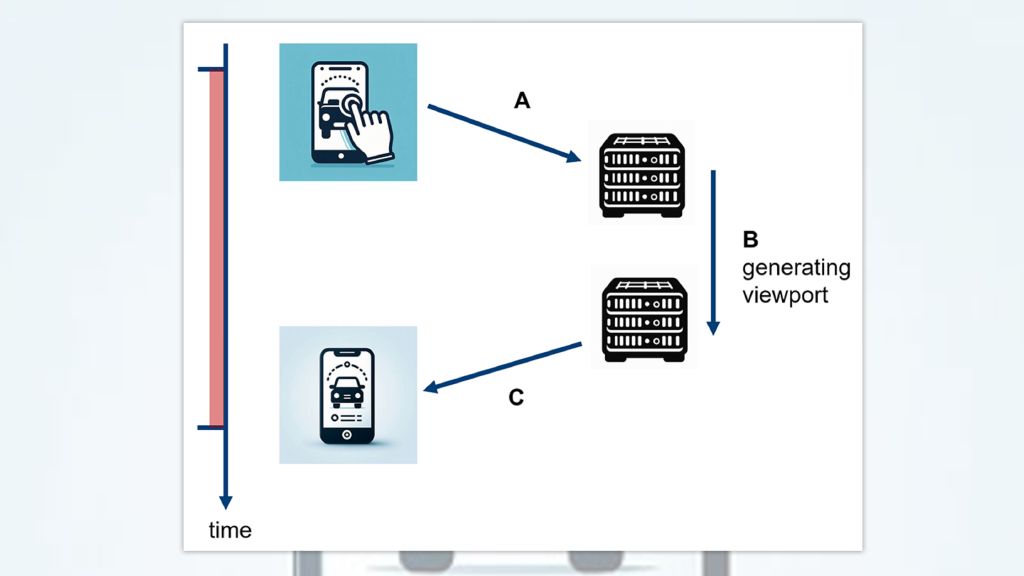
The results for interactive immersive media streams can be seen in the figure below: user interaction data from the user device needs to be transmitted to the XR server (A) to update the rendered view port (B), before transmitting the data back to the user (C). The performance of this loop is a vital factor for quality of experience (QoE) in immersive media applications. End users can be very sensitive to interruptions, delays or delay variations. The total time from user interaction until the view port update appears on the device is motion-to-photon-latency (shown in red in the figure).
A traditional, non-interactive video stream can buffer frames to overcome short interruptions in a data transmission with no impact on the smooth playback of the video. Typically, even so-called live settings can have a buffer for 5-second video content.
By contrast, interactive immersive media streams rendered on a server have almost no buffering. This means that any network transmission distortion will appear almost immediately as jerkiness or short interruptions during playback and increase the latency in user interactions. High quality of experience is only possible with a low latency and high reliability connection. Measuring latency is vital to service quality. Measuring XR service latency with our software involves performing controlled user actions at regular intervals – typically moving a virtual object every 2 seconds. The input is sent to the server and the moved object is rendered on the server and transmitted back to the device. The exact starting point of the resulting motion is detected from the video stream by applying image processing techniques to the video frames using a deep learning model that is easily deployed on smartphones.
Quickly adapting this model to different services and user actions requires training with an advanced few-shot learning approach. In contrast to traditional deep-learning training methods with large datasets for training, the few-shot learning approach optimizes model parameters with just a few samples and avoids the time-consuming collection of large training sets.
Latency measurement results
We selected two virtual-reality services, both involving high-quality car model virtualization, where the view port can be selected from any direction outside or inside the vehicle by either swiping the screen or selecting a pre-defined view with the press of a button. A smartphone connected via an LTE-5G mobile link displays the VR model. The measurement software presses one of the buttons to change the view and the software measures the time until the updated viewport appears on the display.
Two results are shown in the following boxplot as service-f (in blue) and service-p (in orange). Each boxplot shows the result of one motion latency measurement resulting from 8 user interactions. The box stretches over the 4 central measurements and lines (whiskers) extend to the extremes if there is no outlier or the outlier is an individual point. The measurement is limited to a maximum of 2 seconds. Service-f has a latency of about 250 to 300ms under good conditions, whereas the service-p has much higher latency, often about 500ms. The frequency of outliers is a consequence of sensitivity to any possible service degradation.
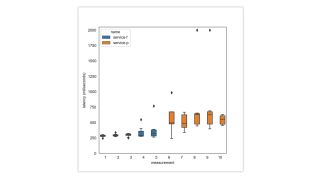
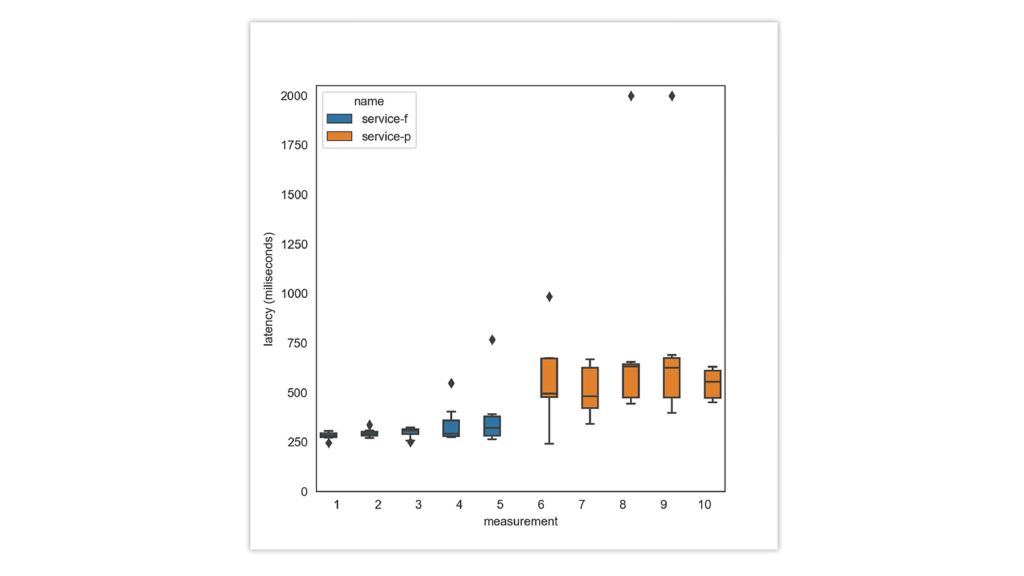
Figure 2: Static latency measurements of two XR services over a mobile network
Parallel measurements on two devices were performed in a moving train. Again, service-f has significantly lower latency, but both services can have far greater latency when network conditions degrade, as seen in the two last measurements (see figure below).
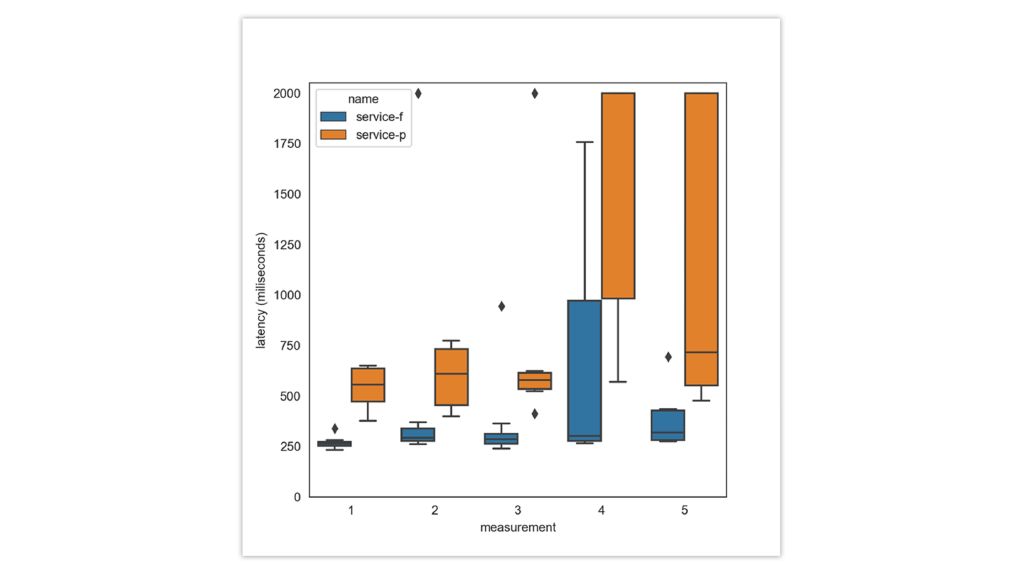
Figure 3: Parallel latency measurements of two XR services over mobile network in a moving train
Of course, to have a more detailed understanding of the results, additional factors must be taken into consideration, such as video compression, video stream adaptivity, as well as how the video is rendered on the server along with many other factors.


