R&S®CEPTOR

Software for radiomonitoring systems

R&S®CEPTOR
Open Lightbox
R&S®CEPTOR
Open Lightbox
R&S®CEPTOR
Open Lightbox
R&S®CEPTOR
Open Lightbox
R&S®CEPTOR
Open Lightbox
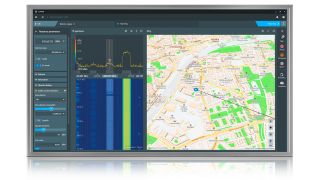
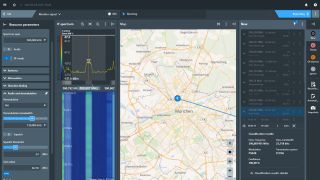
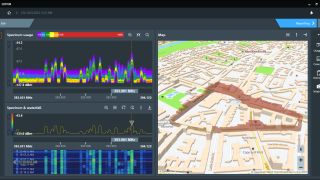
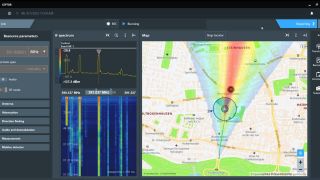
R&S®CEPTOR, radiomonitoring software Search and Observe - monitor signal view Spectrum usage analysis MobileLocator R&S®CEPTOR, software

Key facts

  • Radiomonitoring applications for result-oriented, guided workflows
  • Modern GUI design for intuitive operation and quick results
  • Job concept for execution of applications and collection of results
  • Remote system control through wide area networks 
  • Integrated system monitoring and administration

R&S®CEPTOR radiomonitoring software

Designed for sophisticated user guidance and simplicity of use.

Operators select the appropriate R&S®CEPTOR app from the home screen and follow the steps from job definition to operation and reporting. Practical default settings and partially automated processes deliver the desired results and operators do not have to worry about the specific properties of each sensor.  R&S®CEPTOR software supports a wide range of tasks for government authorities and armed forces, including:

  • Searching for new signals and observing known transmitters
  • Collection of information about spectral usage and active transmitters
  • Monitoring and technical classification of signals
  • Direction finding and geolocation
  • MobileLocator for homing-in on transmitters with a moving DF sensor

Features & benefits

Intuitive graphical user interface

Sophisticated task-oriented operator guidance. 

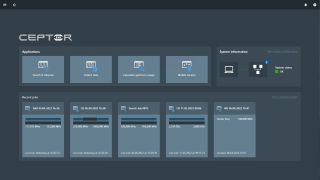
Depending on the assigned task, operators can select the required R&S®CEPTOR app and provide input for the most relevant parameters. All other parameters come with default values suitable to the task. The home screen provides an overview of available apps supported by the system. System information and system health status quickly inform operators about system readiness. Running, stopped and most recent jobs are listed for quick access and further processing.

Home screen shows apps, jobs, system status
Open Lightbox

Home screen shows apps, jobs, system status

Job operation

R&S®CEPTOR jobs handle the operation of specific tasks

Jobs contain task-specific parameter sets, produced results and operator reports. They are defined for local or remote sensors and can be carried out automatically or manually.  Operations with jobs involve three steps:

  • The job is defined with the basic parameters for a task such as frequency range or transmitter lists.
  • Operation produces the required results 
  • Operator reviews results and compiles a report.

Job definition in the Search and Observe app
Open Lightbox

Job definition in the Search and Observe app

App: Search and Observe

Search for new signals and observe known transmitters

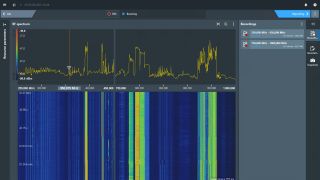
Search and Observe automatically detects new radio transmitters while observing known signal profiles or transmitters. Detected signals are sorted into user-defined operational classes such as ignore or of interest. The system can then automatically trigger an alarm if signals of a defined operational class (such as threats) are detected. Operators can then investigate the signals in the monitor signal view using automatic signal classification and direction finding or geolocation.

Search and Observe - monitor signal view
Open Lightbox

Search and Observe - monitor signal view

App: Collect Data

RF spectrum data recording

The Collect Data app saves RF spectrum data for later offline analysis with the Calculate Spectrum Usage app. Depending on the device, multiple scan ranges can be defined with separate specific settings. Collect Data jobs assigned to remote sensors are transferred via WAN to the remote R&S®CEPTOR station for independent job execution. Results are downloaded to the local control station upon operator request.

Collect Data - spectrum view
Open Lightbox

Collect Data - spectrum view

App: Calculate Spectrum Usage

Offline analysis of recorded RF spectrum data

This app provides various analysis capabilities for recorded RF spectrum data: 

  • Spectrum over time, visualized in RF spectrum and static waterfall diagrams
  • Distribution of recorded signal levels by frequency in a spectrum usage diagram
  • Coverage plot of selected frequencies, visualized in the map

Analysis view of Calculate Spectrum Usage
Open Lightbox

Analysis view of Calculate Spectrum Usage

App: MobileLocator

MobileLocator determines the location of transmitters in urban environments.

Results from a single direction finder installed in any vehicle help overcome multipath propagation problems. A map display with a bearing line, an azimuth histogram and a heatmap guides the operator towards one or more transmitters on the same frequency. The integrated map display with 2.5D view, landscape, terrain shading and buildings for better orientation simplifies transmitter localization in urban environments. 

MobileLocator app
Open Lightbox

MobileLocator app

Request information

Do you have questions or need additional information? Simply fill out this form and we will get right back to you.

Marketing permission

Your request has been sent successfully. We will contact you shortly.
An error is occurred, please try it again later.