Key facts
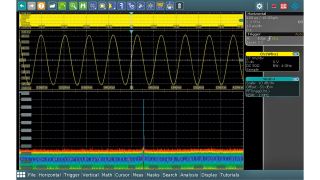
- Multichannel spectrum analysis
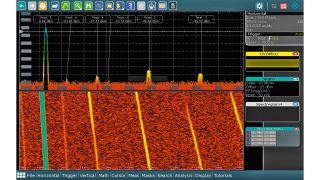
- Display of change in power and frequency over time
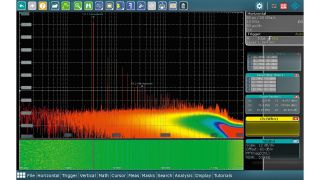
- Frequency analysis with logarithmic display
- Spectrum analysis from DC to instrument bandwidth


Key facts
The option enables spectrum analysis capabilities on the R&S®RTH and R&S®RTM3000 oscillsocopes and enhances the multichannel spectrum analysis capabilities of R&S®RTP, R&S®RTO and R&S®RTE oscilloscopes. The option provides features such as spectrogram display and logarithmic frequency axis as well as an automatic peak list detection and additional detector support for R&S®RTP, R&S®RTO and R&S®RTE.
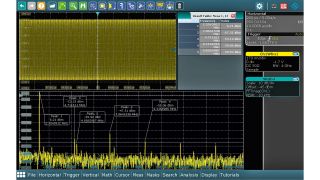
All R&S®RTP, R&S®RTO, R&S®RTE, R&S®RTM3000 and R&S®Scope Rider oscilloscopes come with powerful multichannel spectrum analysis for up to four signals in parallel. The low-noise frontend and the A/D converter’s high effective number of bits provide an outstanding spurious-free dynamic range, so that even weak signals can be identified without difficulty.
Use the spectrum analysis options to analyze time-varying signals in the frequency domain. A spectrogram is a color-coded frequency timing diagram in which the frequency domain is plotted over time. How the signal varies over time is indicated by the intensity and color of each point in the two-dimensional diagram. Oscilloscopes allow you to quickly analyze voice and AM/FM modulated signals as well as signals from radar and frequency hopping systems.
For many measurements, logarithmic scaling of the frequency axis is helpful to better display values of several orders of magnitude. The spectrum analysis options support this function for the spectrum and spectrogram.
Use the peak list measurement function to automatically measure frequency peaks. The frequency peak list is displayed in a table. The power and frequency of the highest peaks can be marked in the spectrum.