Interference hunting in TDD networks - Polychrome display method
Polychrome display method with the R&S®PR100, R&S®PR200, R&S®DDF007 and R&S®MNT100

Polychrome display method with the R&S®PR100, R&S®PR200, R&S®DDF007 and R&S®MNT100
In time division duplex (TDD) networks, the downlink (DL) and uplink (UL) use the same frequency band in different timeslots. When viewing such TDD signals on a conventional spectrum display, it is impossible to differentiate between the two and any other unwanted signals present in the same spectrum. This makes interference hunting extremely difficult.
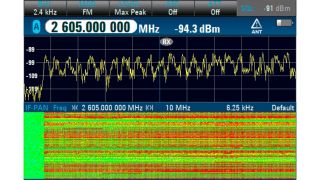
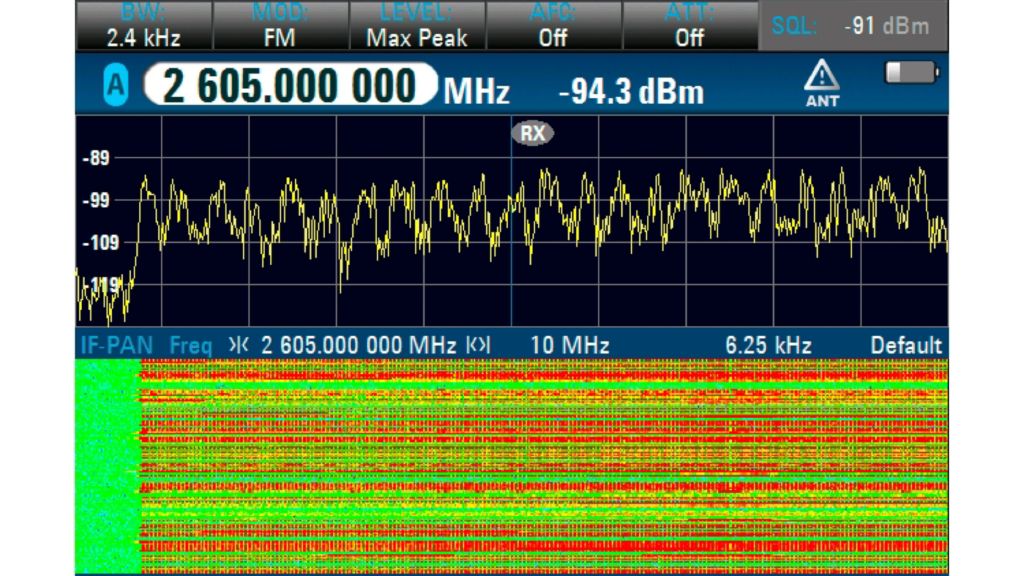
10 MHz realtime spectrum and waterfall display of partial TDD-LTE signal with a relatively persistent interferer at 2602 MHz.
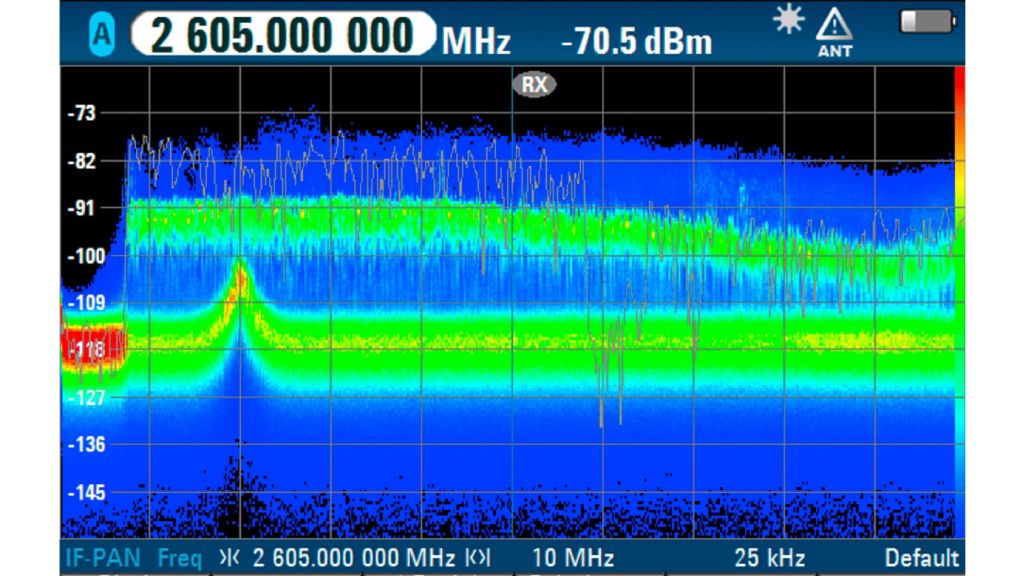
The R&S®PR100 and the R&S®PR200 portable receivers, the R&S®MNT100 RF interference locator and the R&S®DDF007 portable direction finder provide a polychrome display that enables users to visually separate two or more pulsing signals that occupy the same frequency spectrum. This method enables simultaneous monitoring of TDD signals as well as interferers. The user can hunt for interference and, at the same time, remain aware of the signal environment. When using the polychrome display to home in on the interferer, we recommend sweeping the handheld directional antenna slowly to allow sufficient time for updating the signal level on the display.
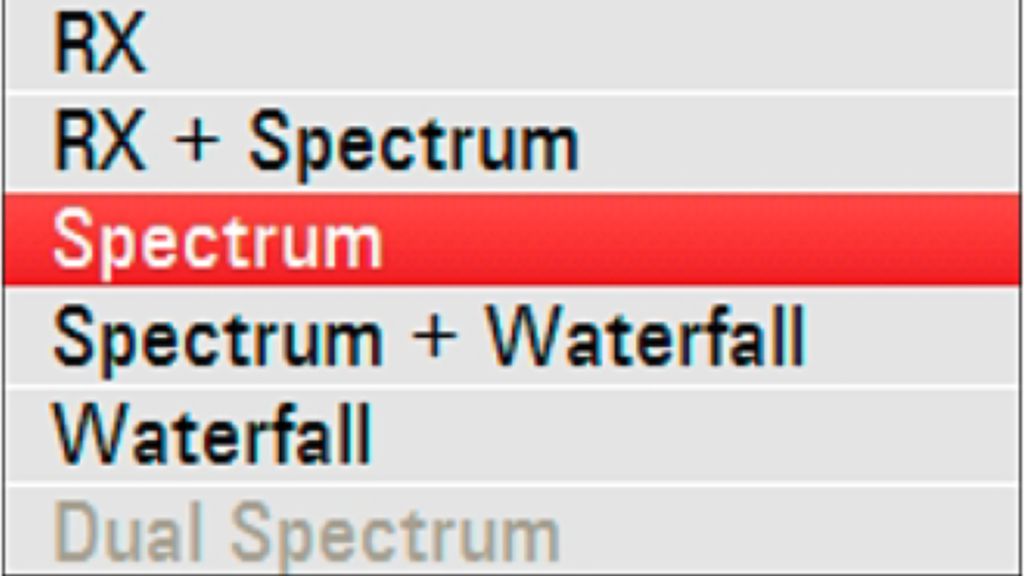
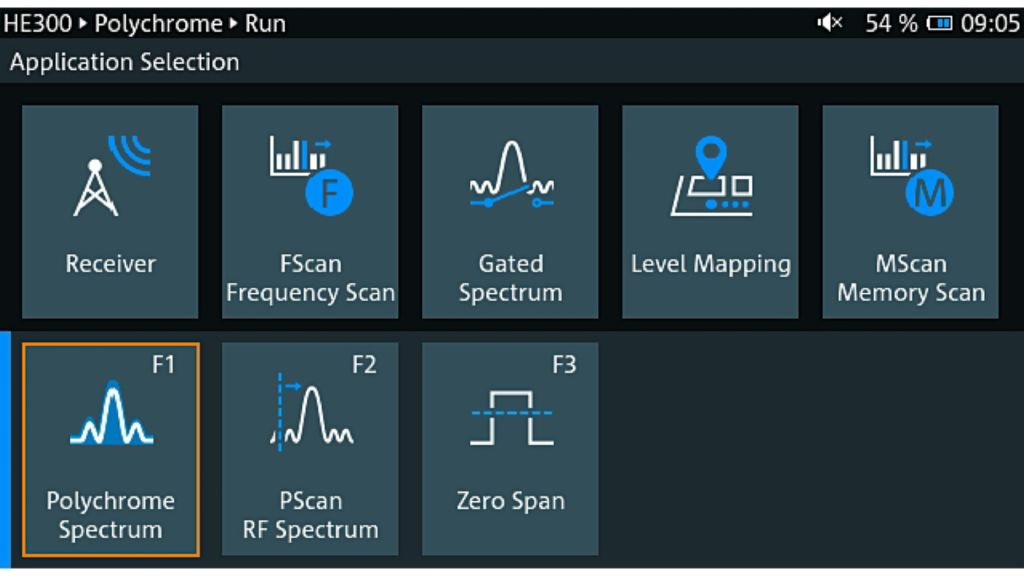
In FFM mode, tune the center frequency to TDD frequency. Press [DISP] button followed by [F1] Display Mode, select “Spectrum” or “RX + Spectrum” display.
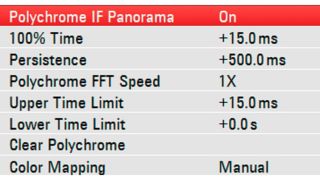
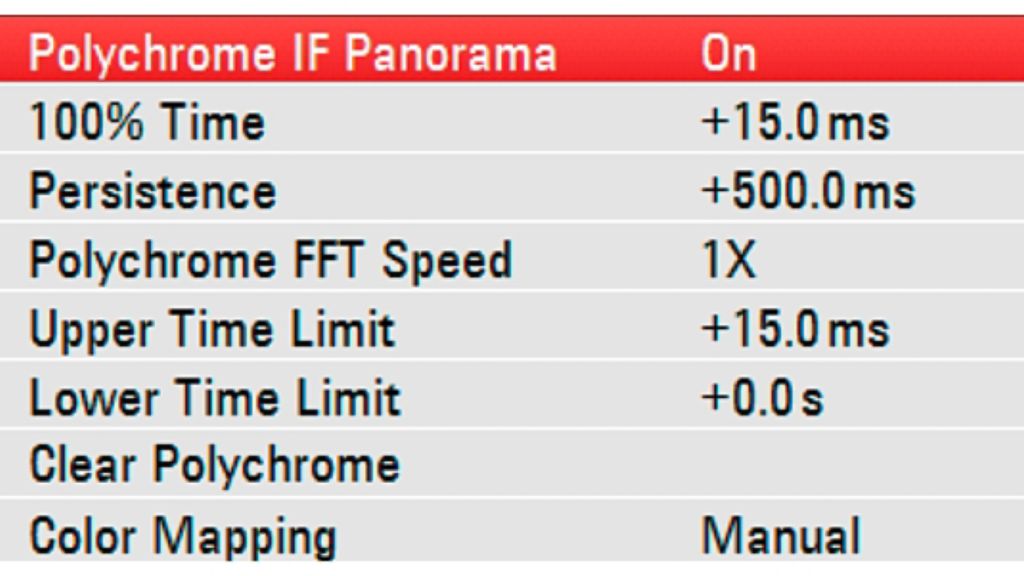
For the R&S®PR100, R&S®MNT100 and R&S®DDF007, the polychrome display is available only in fixed frequency mode (FFM). Make the following settings:
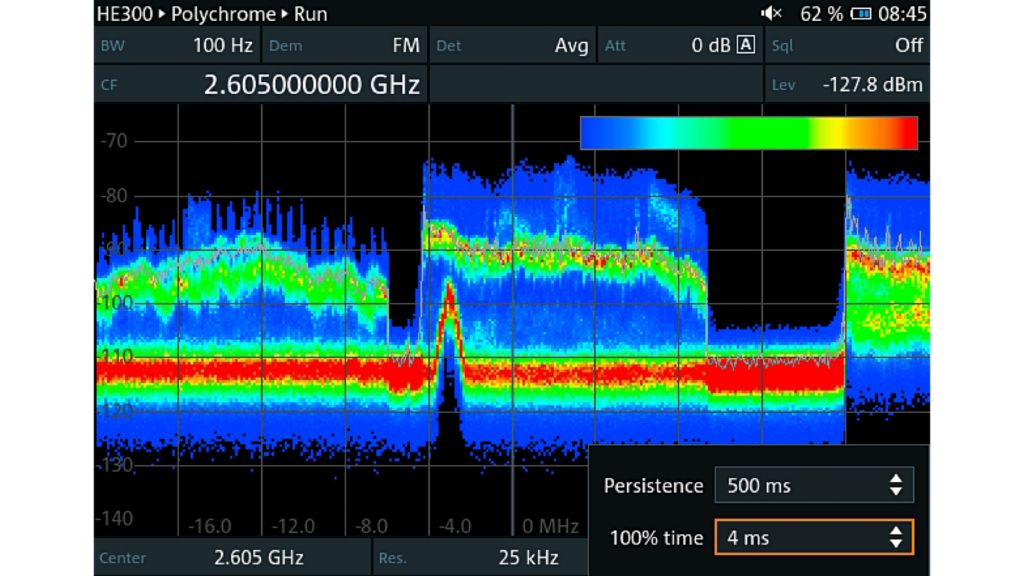


Left side: Example of signal at locations A, B and C of the spectrum display with their respective histogram on the left. Red indicates high frequency of occurrence while blue shows lower frequency of occurrence.
Right side: The 100 % time limit can be adjusted to give better visualization of signals that occur less frequently.
Polychrome display
In polychrome display mode, the frequency of occurrence of a signal is presented as a histogram. In this example, a histogram is produced for each FFT bin of the signals at locations A, B and C. The histogram shows the distribution of signal level values and is mapped to a color scale with the following limits:
Signals that occur very frequently, such as noise, will appear in red, allowing the user to visually differentiate pulsing signals that occupy the same frequency spectrum.