Flexible use of Rohde & Schwarz oscilloscopes' trigger for accurate radar signal analysis

Oscilloscopes are increasingly used to analyze pulsed signals such as radar signals for aerospace and defence as well as automotive applications. The oscilloscopes’ wide analysis bandwidth and manifold trigger capabilities, make them a good fit for the increasing demand for higher bandwidths and accurate signal detection in these applications. R&S®VSE vector signal explorer software is a powerful tool for comprehensive analysis of a variety of signals, providing full support to the Rohde & Schwarz oscilloscope advanced trigger system. Adjusting the trigger settings enables pulses and pulse sequences to be isolated and run full pulse analysis using the R&S®VSE vector signal explorer software.

Your task

State-of-the-art automotive radar modules use frequency modulated continuous wave (FMCW) signals or chirp sequences. To analyze these signals, entire chirp sequences need to be captured before the individual chirps can be analyzed. Since FMCW signal off-times are often significantly longer than chirp sequences, accurately detecting chirp sequence start is essential to limit analysis to the signal portion of interest and to improve analysis speed. This application card shows how R&S®VSE software can be configured to take full advantage of Rohde & Schwarz oscilloscope trigger capabilities for precise triggering on the start of the chirp sequence of a real-world automotive radar signal.

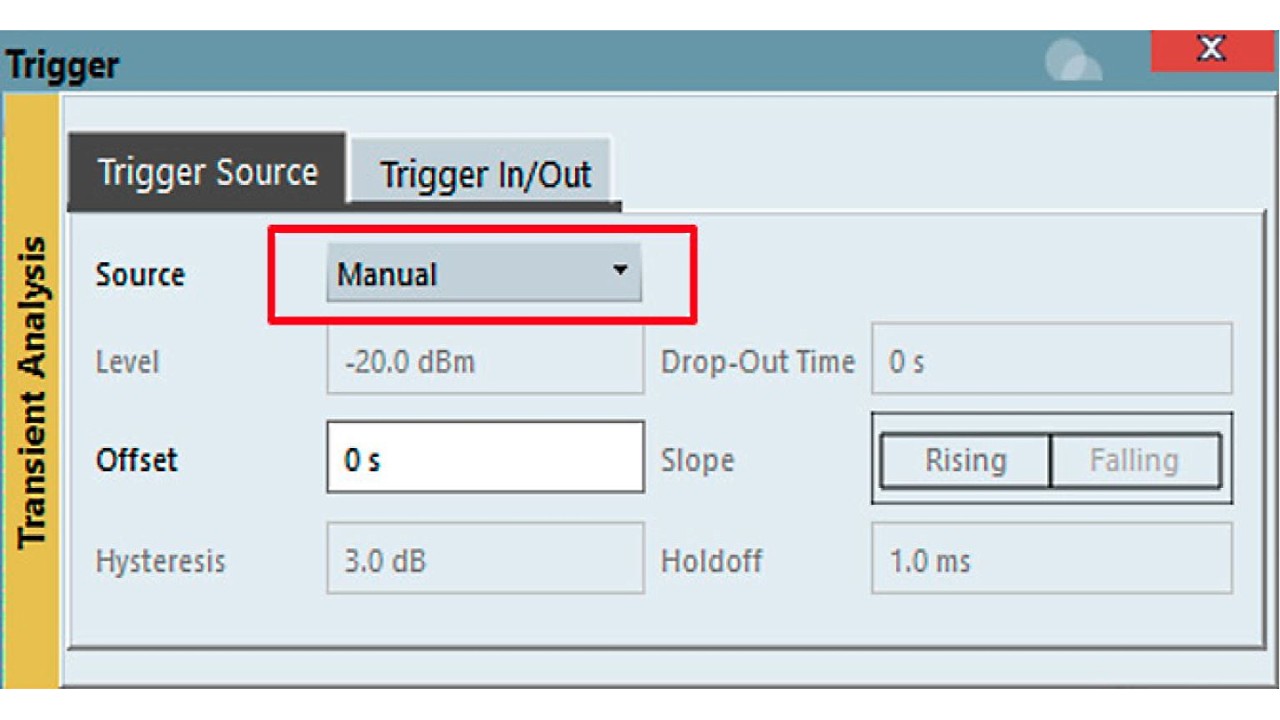
Fig. 1: Configuration of the manual trigger mode in R&S®VSE-K60 transient analysis option.
Open Lightbox

Rohde & Schwarz solution

R&S®VSE vector signal explorer software provides full support for all Rohde & Schwarz oscilloscopes. Users can take advantage of the advanced oscilloscope trigger system and configure the most appropriate trigger type to ensure accurate detection of signals of interest. To activate the oscilloscope trigger support in R&S®VSE software, open the trigger settings in the active measurement channel under Input & Output ►Trigger and change the trigger source to Manual (see Fig. 1).

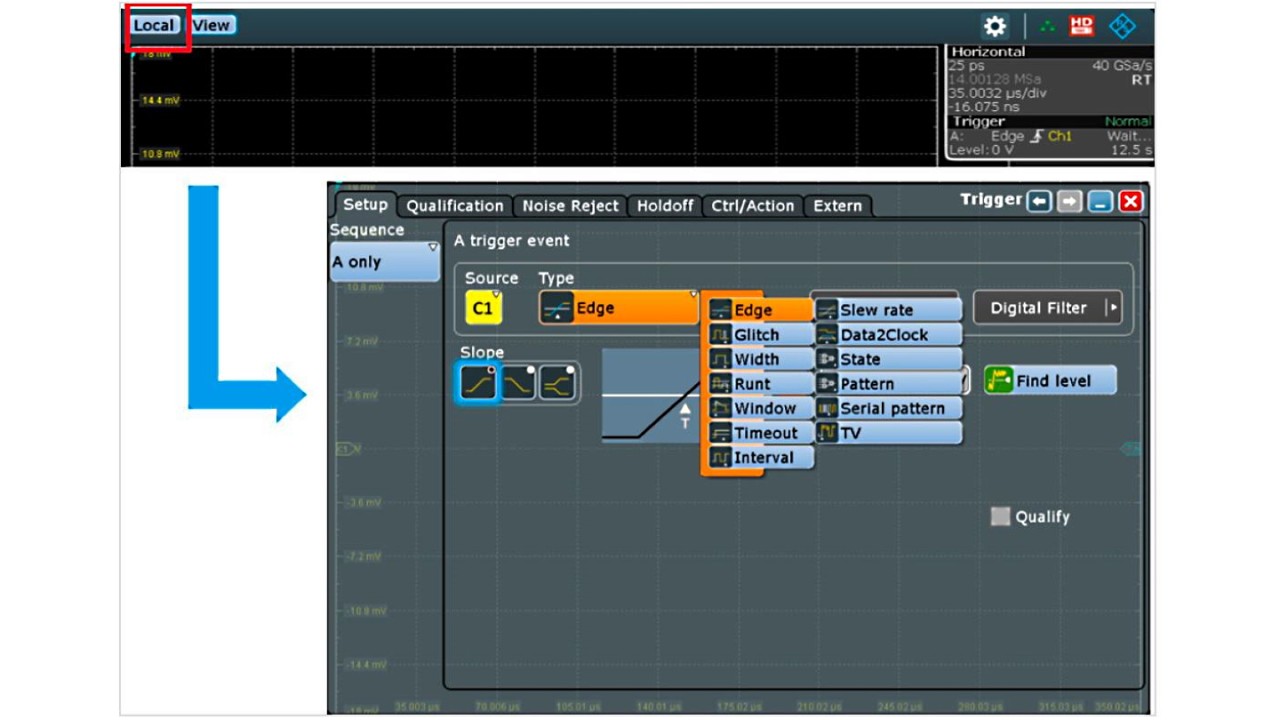
Fig. 2: Switching to local mode to control the oscilloscope and adjust trigger settings.
Open Lightbox

After switching the trigger mode to Manual in R&S®VSE software, the user can also adjust the trigger settings with the oscilloscope on-board tools to isolate pulses for analysis. Simply pressing the Local button on the oscilloscope main screen accesses the oscilloscope user interface and the desired changes can be made (see. Fig. 2).

For example, operators can simply select the most appropriate trigger type (e.g. edge, width, window) or configure a more complex trigger setup exclusive to oscilloscopes (e.g. A-B-R trigger). When making a new acquisition with R&S®VSE, the software takes over the new user-configured trigger settings.

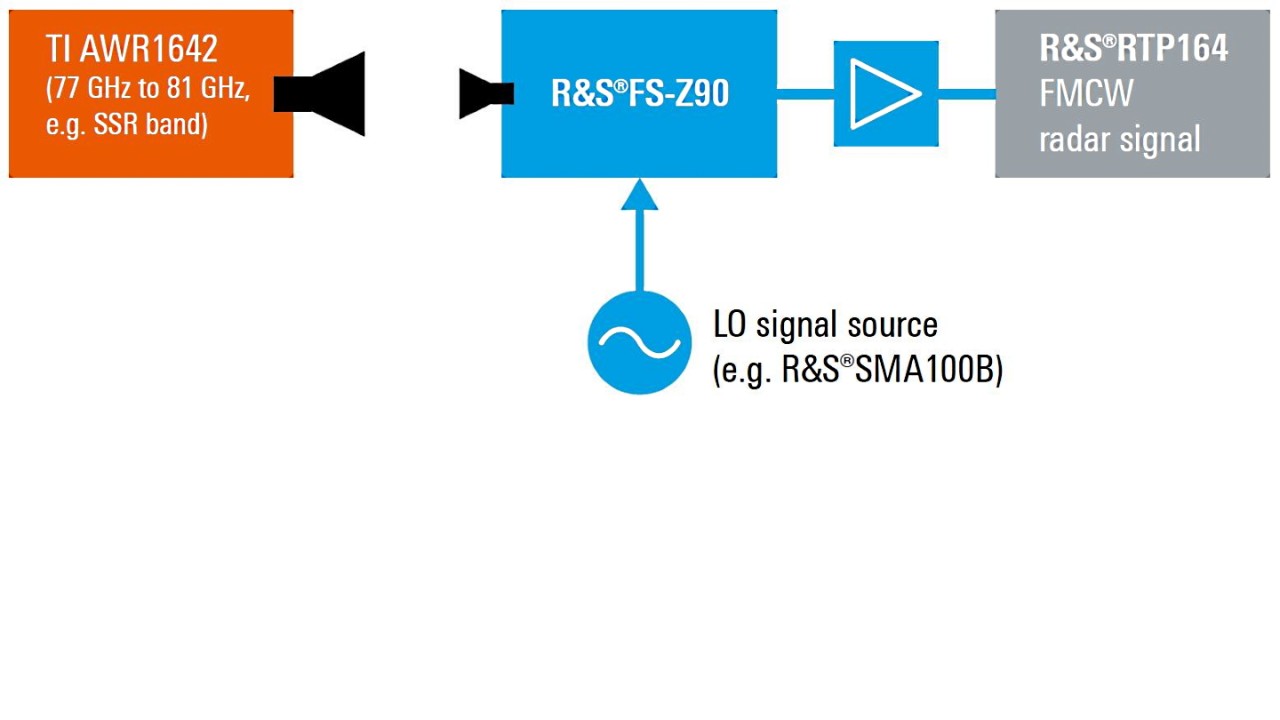
Fig. 3: Measurement setup for automotive radar signal acquisition. The signal is downconverted by an R&S®FS-Z90 harmonic mixer and analyzed in the R&S®RTP164 high-performance oscilloscope.
Open Lightbox

Application

The example illustrates the software’s capabilities with a real-world automotive radar signal. Fig. 3 shows the measurement setup. The automotive radar signal has a bandwidth of 3.9 GHz and is generated by a radar transceiver in the 77 GHz to 81 GHz band, intended for short-range radar (SRR). Each chirp sequence consists of 32 chirps. The signal is transmitted over the air and downconverted by the R&S®FS-Z90 harmonic mixer to an intermediate frequency range within the analysis bandwidth of the oscilloscope.

Measurement setup

The first step for analyzing this signal is selecting the appropriate trigger settings to analyze an entire chirp sequence using R&S®VSE software with the R&S®VSE-K60 transient analysis option.

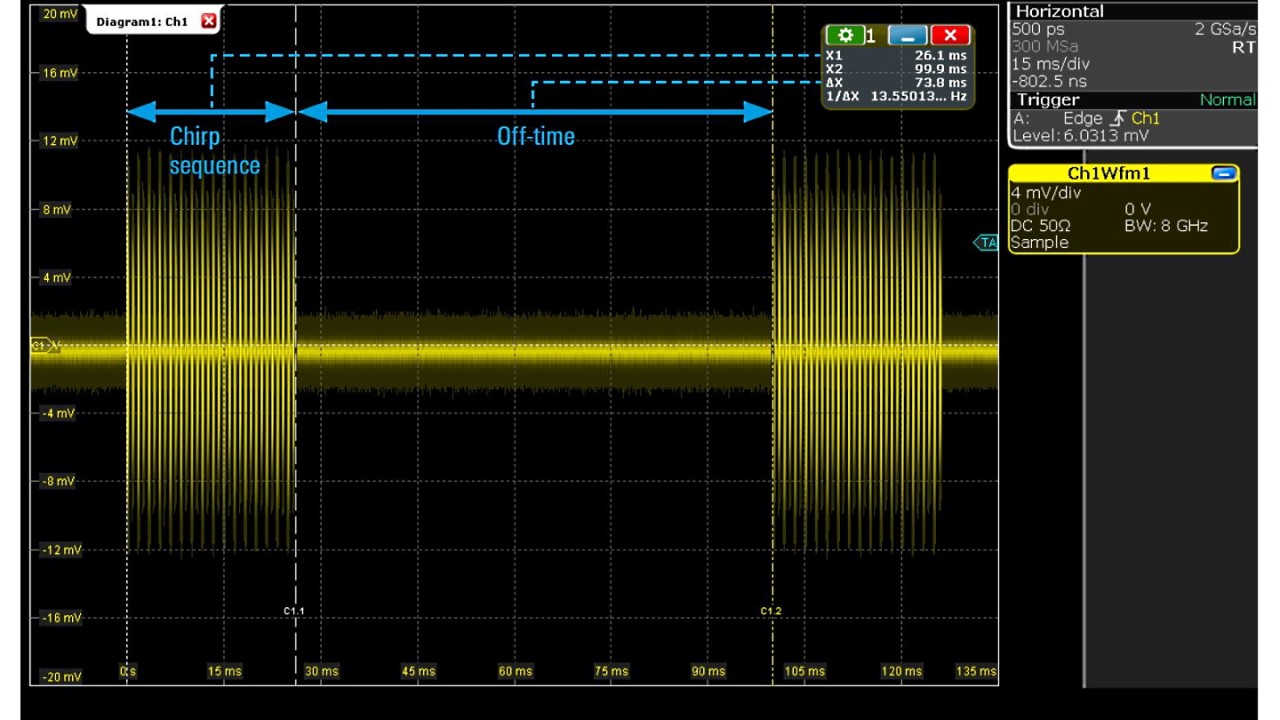
Fig. 4: Using cursors to measure the chirp sequence and off-time.
Open Lightbox

The chirp sequence and off-time durations are assumed to be unknown and need to be measured. Therefore, the acquired signal is intentionally undersampled, so that at least two chirp sequences can be captured and estimate the off-time in between. Fig. 4 shows an off-time value of approximately 73 ms and each chirp sequence has a duration of approximately 26 ms.

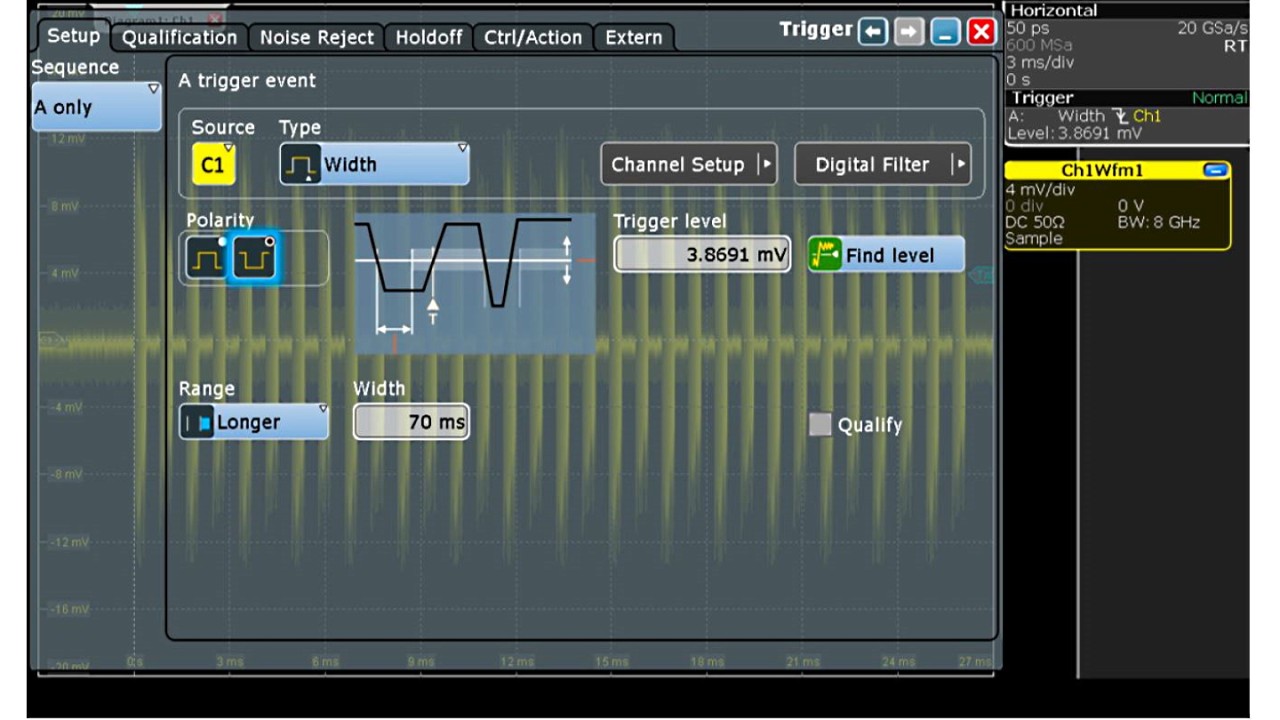
Fig. 5: Width trigger settings to trigger on the start of the first chirp in the chirp sequence.
Open Lightbox

Set the width trigger with negative polarity in the same range as the measured off-time. This is an easy way to trigger on the start of the first chirp in the sequence.

Configure the trigger as follows:

  • Start R&S®VSE and open a new transient analysis measurement channel
  • Set the appropriate center frequency (in this example 3 GHz after downconversion)
  • Set the desired analysis bandwidth (in this example 4 GHz)
  • Set measurement time to capture an entire chirp sequence (in this example 30 ms)
  • Set the trigger mode in R&S®VSE to Manual (see page 1)
  • Press the Local button on the oscilloscope screen to take control of the instrument, open the trigger settings and configure the trigger as shown in Fig. 5
  • Return to R&S®VSE and start acquisition

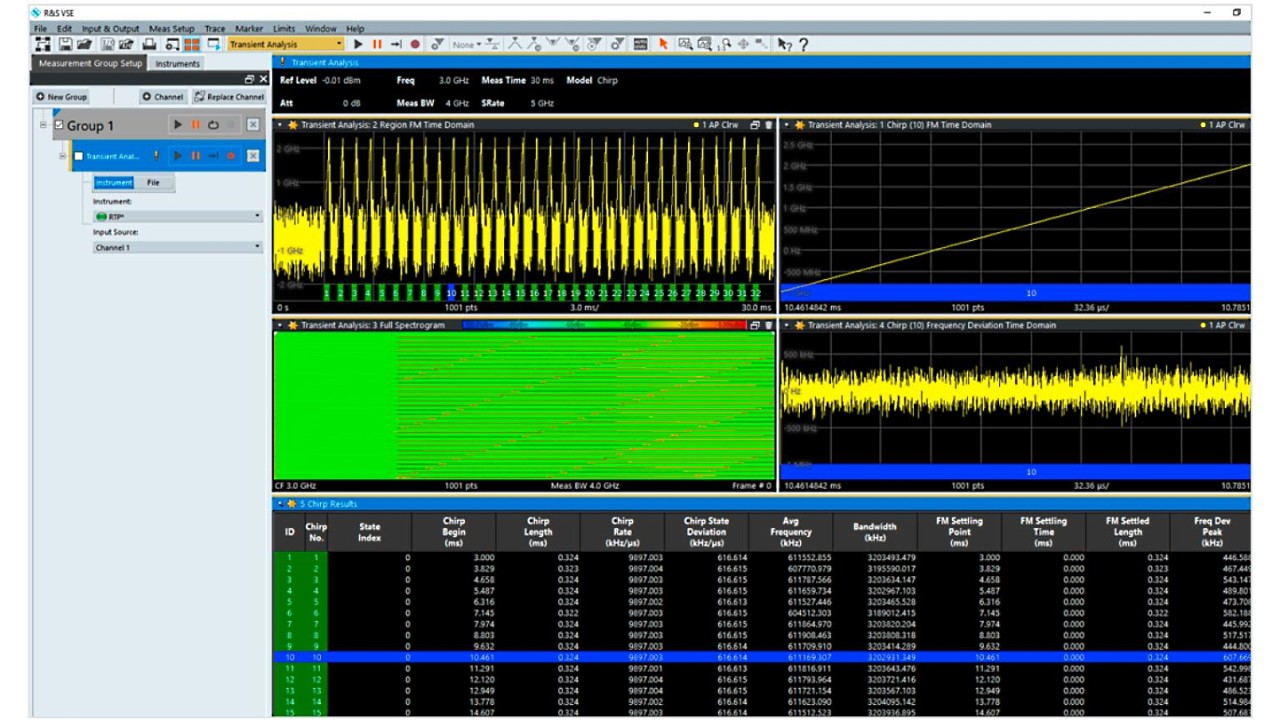
As shown in Fig. 6, the pulse sequence is properly captured. All 32 chirps are detected and their properties summarized in the chirp results table. It is also possible to focus on one specific pulse and open more detailed measurements by selecting a chirp in the summary table.

Fig. 6: Measurement results with R&S®VSE-K60.
Open Lightbox