Understanding EMI debugging

Interested?

R&R&S®Essentials | Digital oscilloscope and probe fundamentals

Understanding EMI debugging with oscilloscopes

One of the measurements often performed with an oscilloscope is EMI debugging. For an error-free and valid analysis, it is important to understand what EMI and EMI debugging is and what has to be considered during the measurement.

What is EMI?

EMI stands for electromagnetic interference, that is unintended and undesired radio frequency emissions generated by a device. Almost everything that runs on electricity produces various unintended or spurious emissions. EMI testing is important because these emissions can cause problems for other electric or electronic devices. These problems can range from relatively minor and merely annoying effects like pixilation on a screen or audio artifacts. In some cases unwanted emissions have led to physical damage or even human injury and death. Therefore, EMC regulations and standards exist with regards to the acceptable levels of emissions at different frequencies.

Most electrical and electronic device manufacturers have to test for compliance to these standards, and this testing is often done in a shielded or anechoic chamber , using specialized antennas and receivers. When issues are detected, additional grounding and shielding are two of the more common ways of reducing or eliminating unwanted emissions.

What is EMI debugging?

EMI compliance testing is performed in the so-called “far field”, where RF propagates through space more or less as a plane wave whose electrical and magnetic components have roughly the same magnitude. Depending on signal frequency, transmitting antenna, etc., the far field begins a wavelength or two from the source. Compliance testing in the far field shows existing problems in the form of emissions above a given threshold.

EMI Debugging, on the other hand, is done in the “near field” to determine the location of the problem – that is, what component, wire, trace, etc. is responsible for the unwanted emission. To remove unwanted emissions and make a device compliant, it is important to know what part of the device is creating these emissions.

The EMI debugging process consists of three steps:

  • Detecting and characterizing the emissions
    what are the frequencies and levels of the undesired signals? Do any of them display behavior that could help identifying them? For example, are they integer multiples of a clock signal?
  • Locating the physical source of the emissions
    which components, wires, traces, etc. contribute to these emissions?
  • Employing various remediation techniques
    like grounding and shielding to remove or at least reduce the level of these emissions.

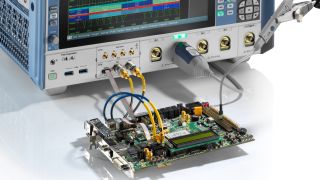
The most common tools used in EMI debugging are near field probes and oscilloscopes.

Near field probes used for EMI debugging

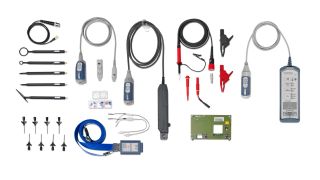
Near field probes are different than passive or active probes used in most other types of oscilloscope measurements. Near field probes can be divided into two main groups: magnetic field probes and electric field probes.

In many cases, radiated emission levels can be quite small, so occasionally, a preamplifier is also used between the probe and the scope. If a preamplifier is not used, a sensitive scope is needed. Correct probe selection and use is critical in getting good results during EMI debugging.

Magnetic field probes and electric field probes

Magnetic field probes (H field probes)

H-field probes are typically in the shape of a loop. Maximum response occurs when the loop is at 90 degrees to the signal, or when the magnetic field is “passing through the loop”. Minimum response occurs when the loop is parallel to the signal. Typically, the loop is rotated during troubleshooting. With regards to the size of the loop, there is a trade-off between resolution and sensitivity:

  • a large loop is more sensitive, but has lower spatial resolution
  • a smaller loop is less sensitive but makes it easier to narrow down the location of signal’s source

Note that in a pinch, you can create a crude H-field probe out of a normal passive probe simply by connecting the probe ground lead to the probe tip.
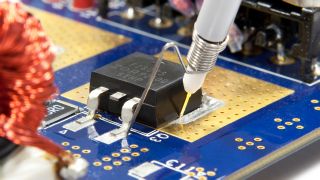
There’s a second, non-loop type of magnetic near-field probe that has very high spatial resolution. It can also be used to determine the current on the surface of ICs or through capacitors. The magnetic field is detected at the gap on the probe tip, indicated by a white line in the image below.

Electric field probes (E field probes)

E-field probes have their maximum response when they are placed parallel to the measured electric field. For most conductors, the E-field is perpendicular to the surface of the conductor, so E-field probes are held perpendicular to the tested conductors.

Large area probes are used for measuring electric fields emitted from structures with larger surface areas. The top of the probe is electrically shielded, and measurements are made using the bottom side of the probe.

The smaller near-field E-probes are shielded to suppress fields from other adjacent structures. These probes have very high spatial selectivity: typically, less than a millimeter. This means they can often be used to isolate the location down to a single narrow trace on a printed circuit board.

Oscilloscopes used in the frequency domain

With regards to the use of oscilloscopes in EMI debugging, one important point is that scopes are normally used to view amplitude, that is voltages in the time domain.
For EMI debugging, the level of unwanted emissions as a function of frequency is considered. Thus, frequency domain measurementsare needed. The conversion from the time domain to the frequency domain is done using the fast Fourier transform, or FFT. Most modern digital oscilloscopes have FFT support, although performance and functionality may vary significantly between different scopes. FFT mode on oscilloscopes usually is very similar in operation to spectrum analyzers, for example like setting the center frequency, span or resolution bandwidth.
In addition to the basic FFT operation, additional helpful functions include spectrograms, frequency mask triggers, and peak lists.

Spectrograms

An FFT display shows the standard frequency domain representation of signals as power versus frequency. A spectrogram adds the dimension of time, in other words, power versus frequency versus time is displayed. In a spectrogram, the y-axis is time whilst power is mapped into color. In most default spectrogram color schemes, higher power is indicated by moving towards the color red and lower powers are indicated by moving towards the color purple.

Note that the color table or mapping used is very often adjusted to show signals of interest more clearly or simply based on user preference. Spectrograms are valuable because they help visualizing things that might otherwise be hard to see, like time varying signals or low-level continuous signals near the noise floor.

Frequency mask trigger

Some EMI issues involve undesired or spurious signals that are continually present, but many issues involve intermittent signals that are difficult to detect and / or analyze. One way of resolving these types of issues is to trigger on power that exceeds a user-defined threshold at a given frequency or over a given frequency range. This is unlike “normal” oscilloscope triggering based on voltage changes over time. A so-called frequency mask trigger allows the user to define a power-versus-frequency mask. When this mask is violated, the trigger stops the scope acquisition and the captured data can then be analyzed in detail.

Peak list

In EMI debugging, higher level or “peak” signals are often the most interesting or the most important. In part because these signals may violate regulatory thresholds, and in part because higher-amplitude signals tend to cause more problems than lower-amplitude signals. Identifying the “peaks” within a spectrum is very important. These peaks can be found in several ways, such as manually inspecting the graph and / or using cursors or markers. Both of these are time-consuming and error prone. Most modern oscilloscopes have a peak search or peak list function that will automatically return a list of the highest amplitude signals and their respective frequencies.

Frequency mask trigger

Peak list signals

Summary

  • EMI, or electromagnetic interference, refers to problems created by undesired radio frequency emissions being generated by a device under test.
  • Most electrical and electronic devices are tested to ensure that their levels of emissions conform to a standard.
  • This compliance testing is usually done in the far field, by using chambers, large antennas, and spectrum analyzers or EMI receivers.
  • The process of resolving any detected EMI issues is called EMI debugging, and is performed in the near field, most commonly using oscilloscopes and near-field probes.
  • Proper use of near field probes is very important for getting good results quickly.
  • The two types of near field probes are Magnetic field (H-field) and Electric field (E-field) probes.
  • FFT function of an oscilloscope is used to turn a time-domain instrument into a frequency domain instrument, since EMI debugging involves looking at power versus frequency.
  • Additional FFT-related functions, such as spectrograms, frequency mask triggers, and peak lists are also very helpful in debugging EMI issues.

Do you have any questions about EMI debugging or our EMI debugging solutions? Our experts will help you.

Curious to learn more about test fundamentals?

Sign up for our newsletter