Written by Andreas Roessler | July 5, 2021
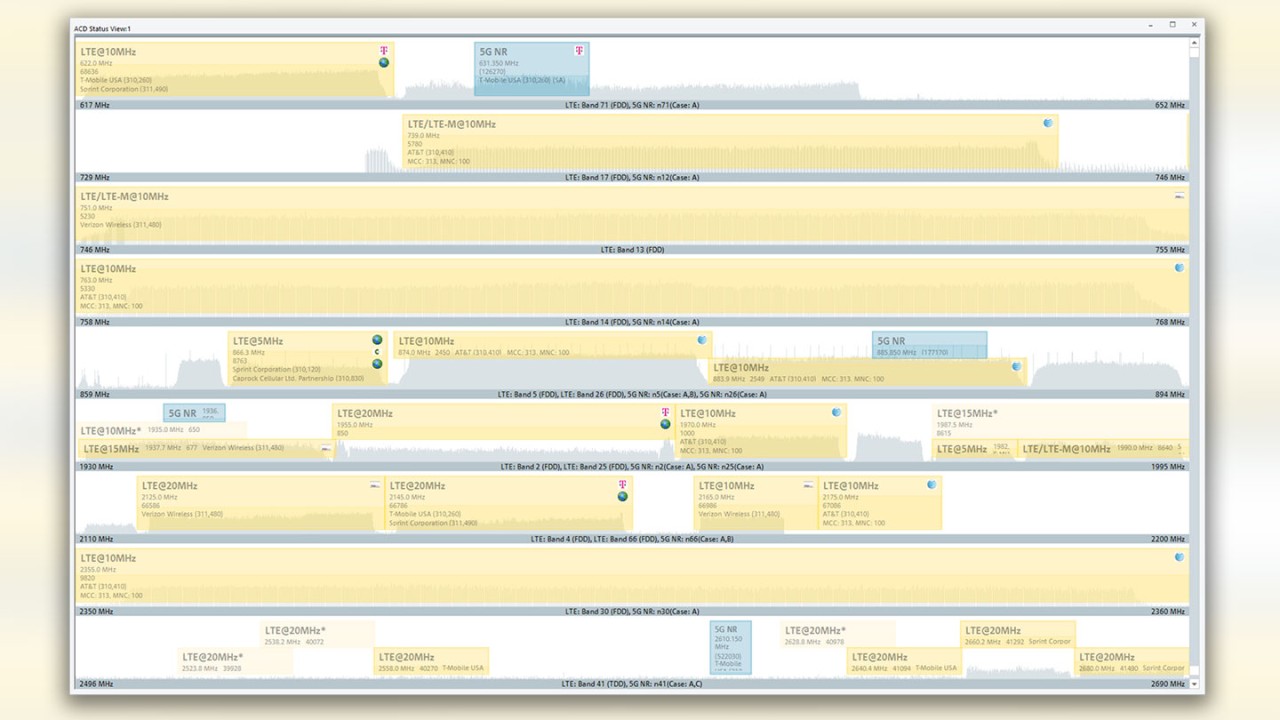
The setup described in part 3 of this blog post was tested in Dallas/Fort Worth (DFW) metroplex in Texas. No prior knowledge about frequency bands or LTE or 5G networks in use was provided for the drive test. The Rohde & Schwarz R&S®TSMA6 autonomous mobile network scanner was configured in automatic channel detection (ACD) mode to scan for frequency bands used in North America.
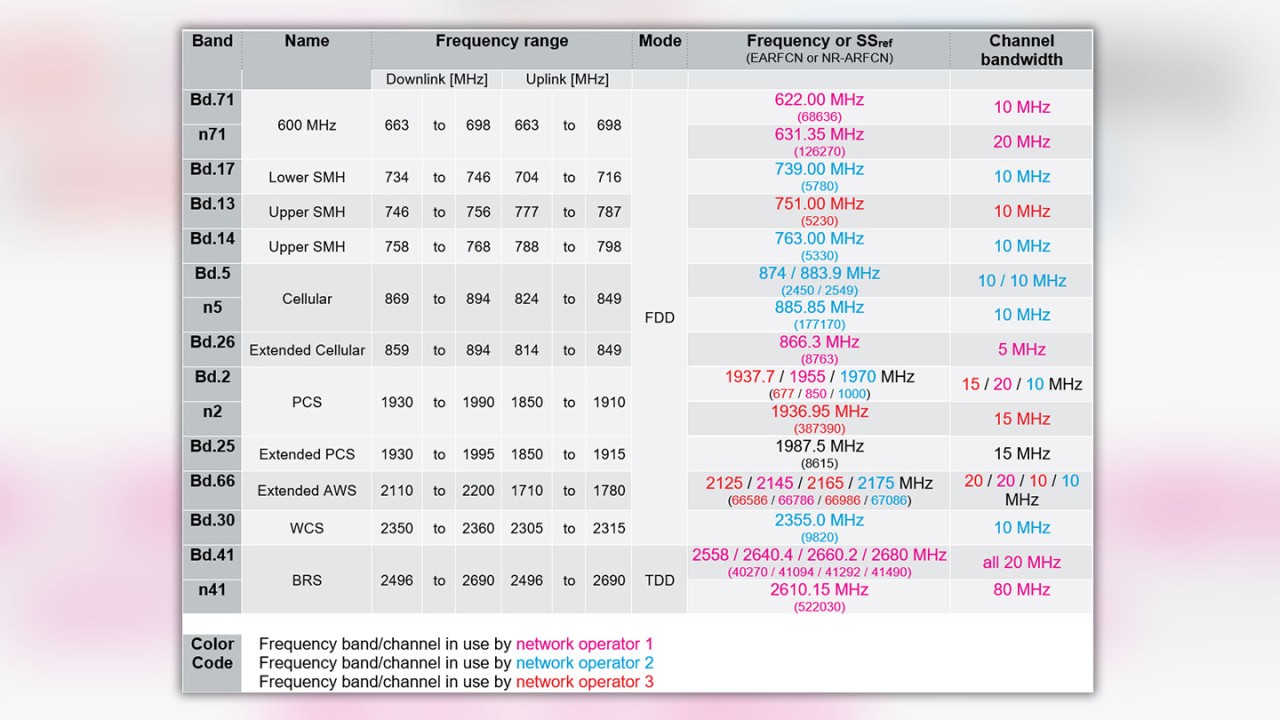
After an initial detection and drive test, the ACD was optimized to scan only the frequency bands used in the DFW area. Figure 1 shows the ACD scan results and Table 1 gives an overview of the detected frequency bands, channel numbers, bandwidths and network operators using a specific LTE or 5G NR carrier.
What 5G NR network types are accessible in the DFW area?
The initial frequency scan revealed four “on-air” 5G NR signals. The scanner detected the synchronization signal block (SSB) for the first 5G NR signal in frequency band n71 (600 MHz) at synchronization signal reference frequency (SSref) 631.35 MHz which corresponds to NR absolute radio frequency channel number (NR-ARFCN) 126270.
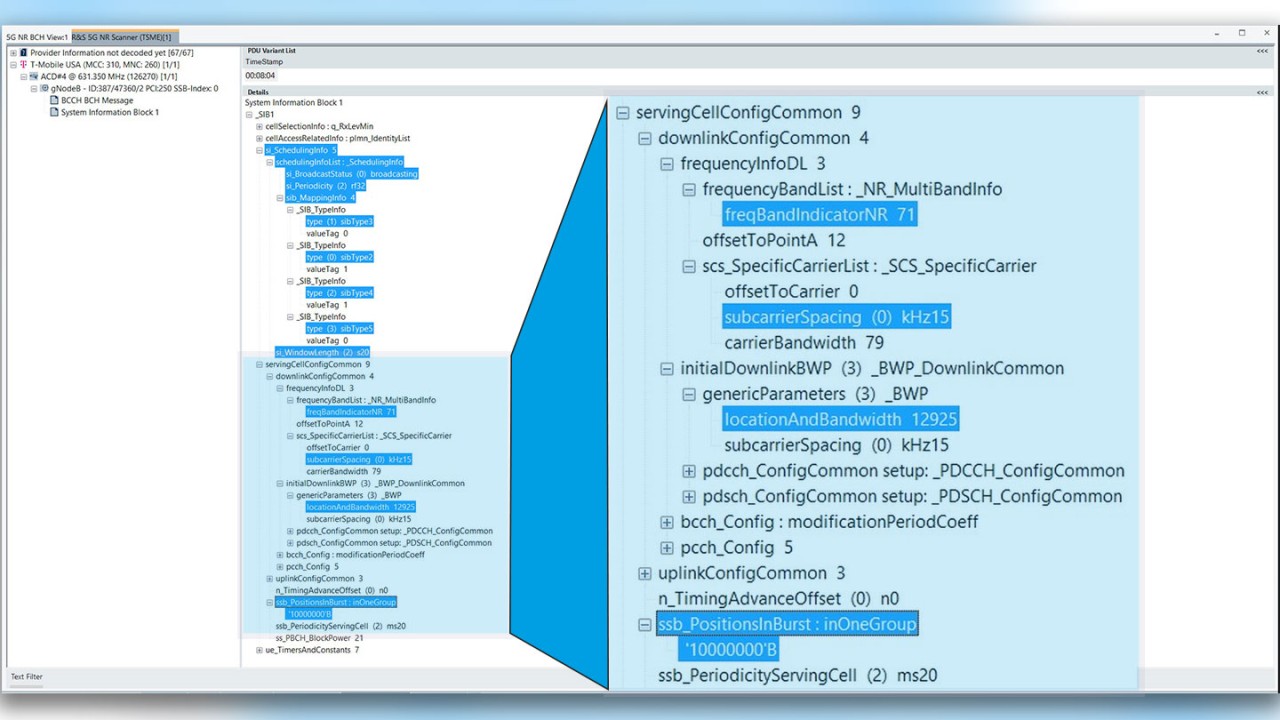
The physical broadcast channel (PBCH) is part of the SSB and carries the master information block (MIB), which broadcasts information about detecting system information block type 1 (SIB1). SIB1 informs 5G devices about scheduling for all other relevant system information. If SIB1 is detected in a 5G network, it is usually standalone (SA). In other words, such deployments do not require an LTE anchor to exchange signaling and control information between the network and device for connection to the 5G radio access network (RAN).
However, most deployments are still non-standalone (NSA). If a subscriber to a specific operator has one of the latest 5G mobile devices supporting SA, the low-frequency band serve as the coverage layer in the 5G network. SIB1 provides further information about subcarrier spacing (information element called subcarrierSpacing set to 15 kHz), the signal bandwidth (locationAndBandwith 12925; equal to 48 physical resource blocks (PRB)) and the number of transmitted SSB beams, which is only one here (Figure 2).
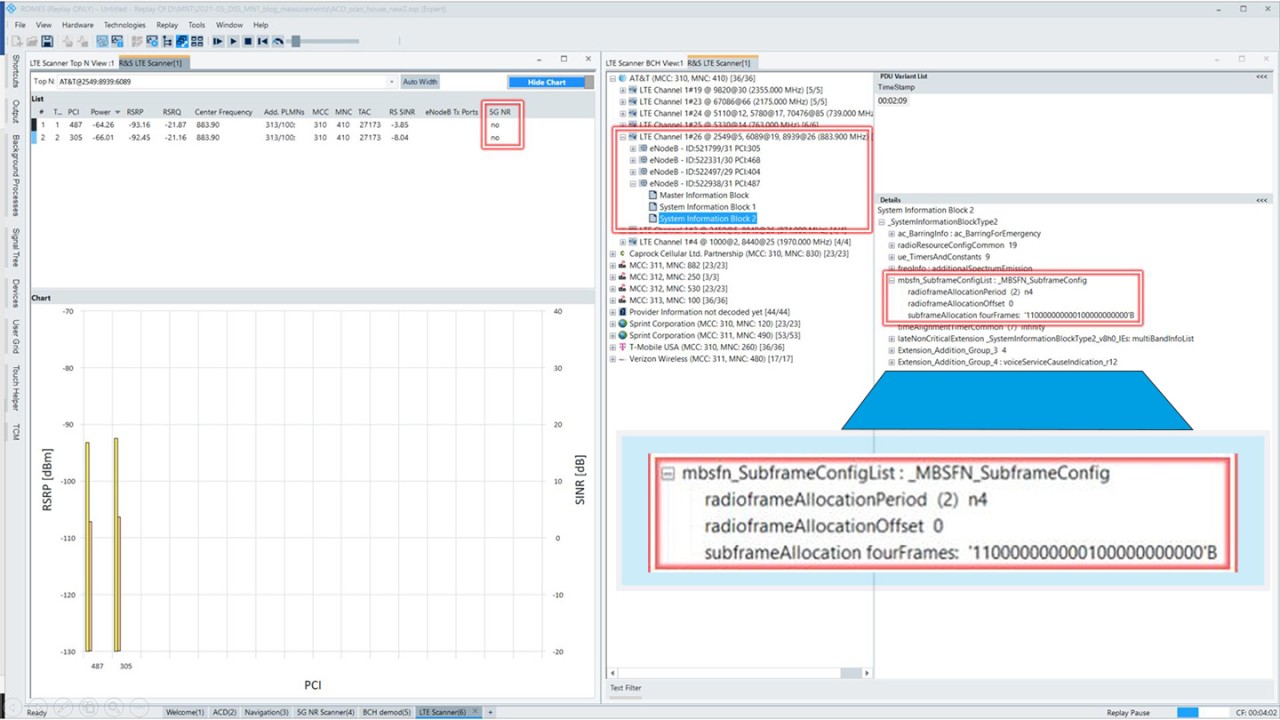
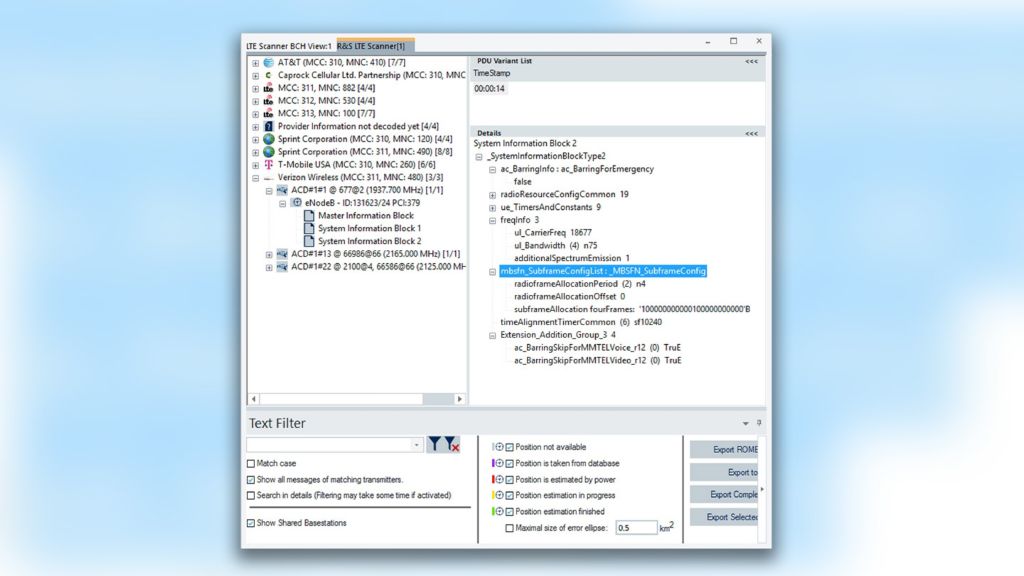
The scanner detects the next set of 5G NR signal SSBs in frequency band n5 at 885.85 MHz (NR-ARFCN 177170). The ACD view shows that this signal overlaps with a 10 MHz LTE signal. Based on the methodology described in part 3, this was the first sign that LTE and 5G NR coexist and share access to a specific frequency band. Next, the SIB2 was checked for the LTE signal at 883.9 MHz (EARFCN 2549) for potential configuration of MBSFN subframes, allowing transmission of the 5G NR SSB and the channel state information reference signal (CSI-RS) configured as tracking reference signals.
Figure 3 contains a lot of interesting information. While still scanning for all configured LTE and NR frequency bands, the view focused only on band 5 and the specific network operator. In this position, the scanner detected two radio cells with the 305 and 487 physical cell identities (PCI), both at shallow power levels. However, the scanner still decoded the relevant system information block.
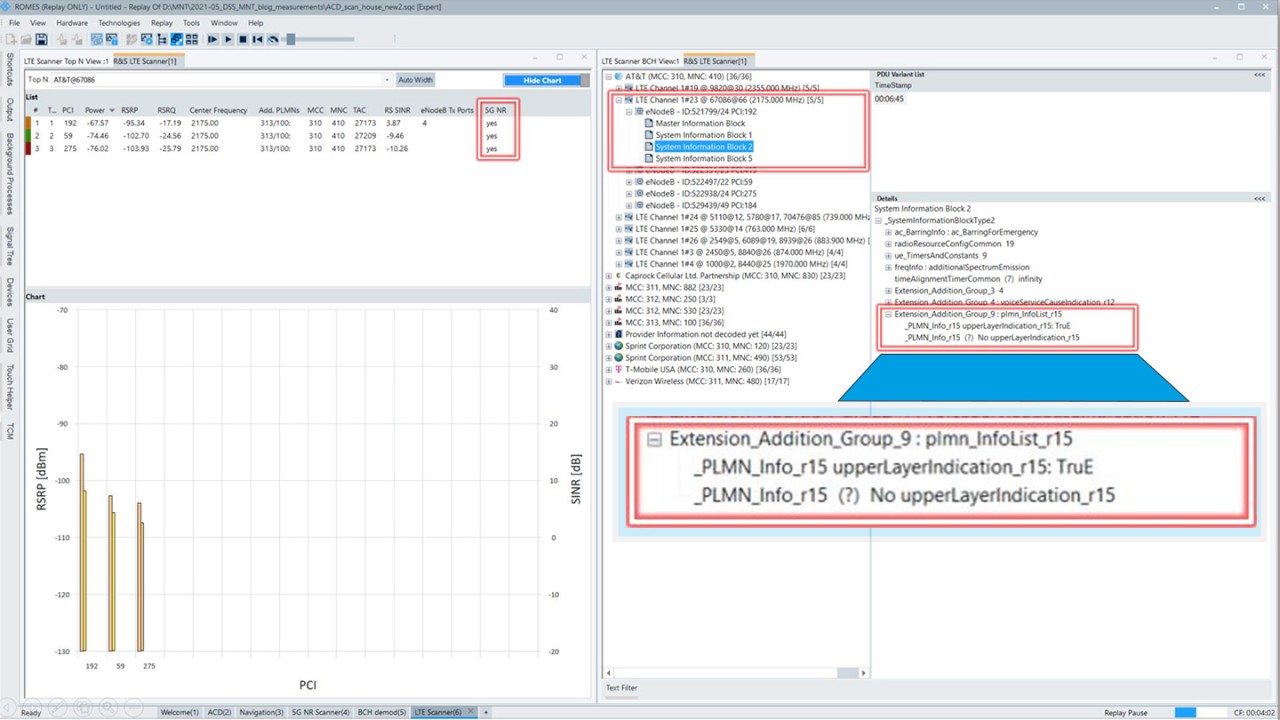
First, SIB2 revealed that the network configures MBSFN subframes in DSS as discussed in part 1 of this blog. Second, SIB2 can also indicate to the mobile device whether the specific LTE carrier can support the terminal connection to 5G RAN, which it could not. Using the deployed 5G NR carrier in DSS mode meant the LTE anchor carrier needed to be on a mid-band frequency band for this network operator, such as band 2 or band 66.
Cross-validation of information broadcast in SIB2 for both frequency bands reveals the required upper layer indication (PLMN_Info_r15 upperLayerIndication_r15) is set to “true” (Figure 4).
We can conclude that DSS is only activated from this network configuration if the primary LTE cell is in a mid-range frequency band (Bd.2, Bd.66). If the serving cell is a lower frequency band (Bd.12 or Bd.5) for the operator, then the network cannot add the 5G NR carrier deployed in Bd.5 to the connection.
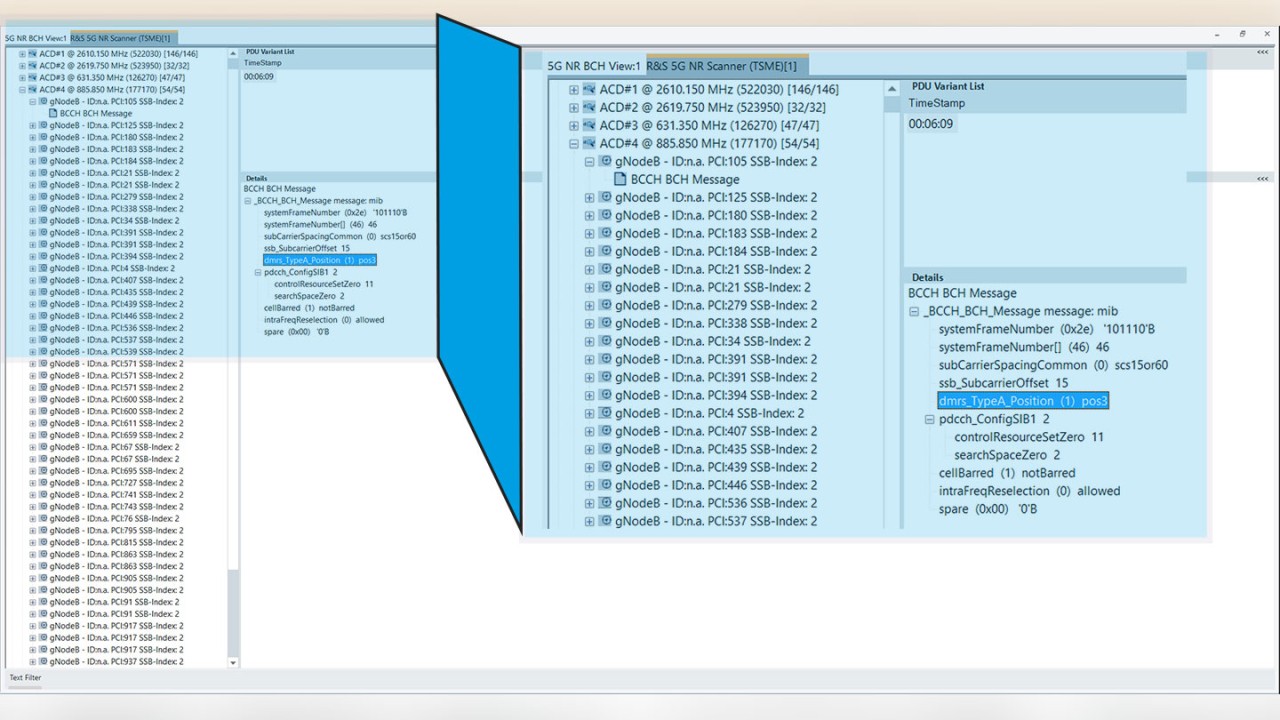
The next item to check was whether the symbol in a 5G NR slot carrying the demodulation reference signal for the physical data shared channel (PDSCH DMRS) was in position 3, meaning the transmission occurred in the third slot symbol. Part 2 of this blog series explained that this setting is a prerequisite for 5G NR transmission in standard LTE subframes while applying rate matching around the omnipresent cell-specific LTE reference signals (Figure 5).
Our analysis of scanner-based information revealed that the network operator owning licenses for Bd.5 and n5 applied DSS-based spectrum sharing for this particular frequency band.
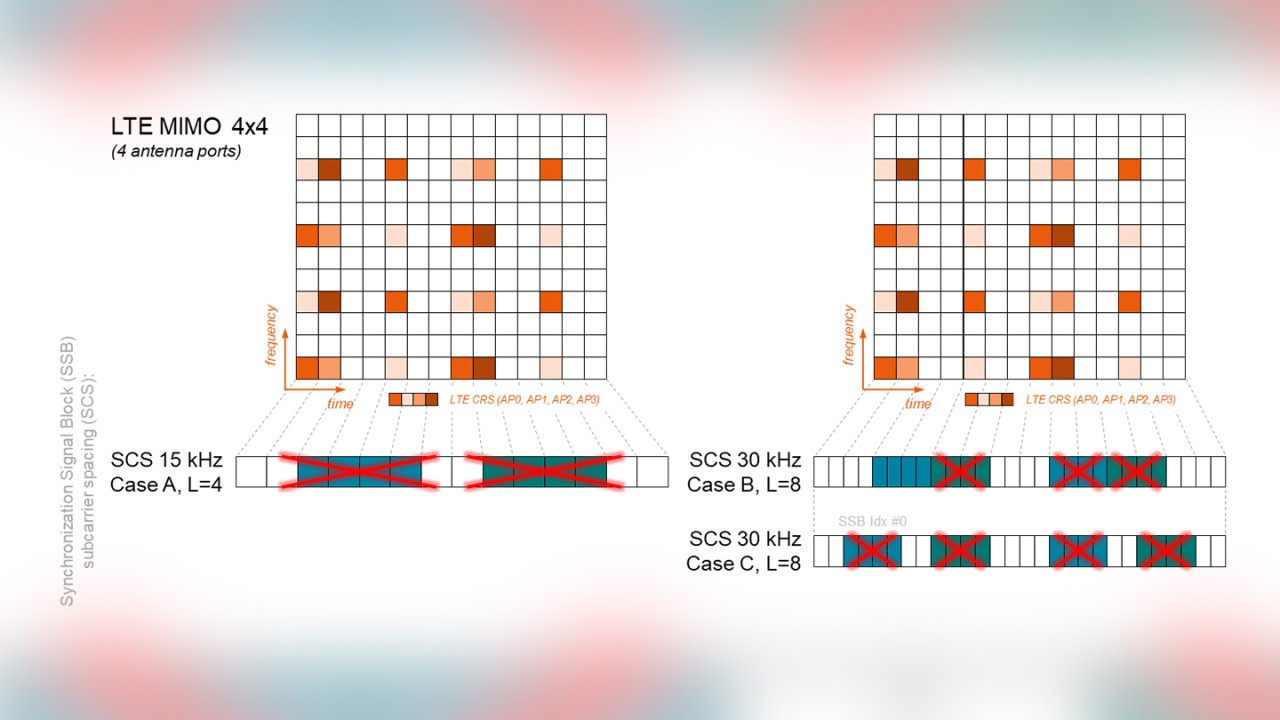
Returning to the detected 5G NR signals in the ACD scan, the receiver detected another SSB set in frequency band n2 that shared spectrum with LTE frequency Bd.2. Decoding the MIB revealed the initial PDSCH DMRS position was symbol 3, a prerequisite for LTE CRS rate matching. Decoding the 5G NR MIB revealed 15 kHz subcarrier spacing and MIMO 4x4 mode (based on LTE MIB decode) for the LTE deployment. As illustrated on the left side of figure 6, this configuration demands MBSFN subframe configuration as it would otherwise lead to a conflict in mapping the SSB.
Checking SIB Type 2 (figure 7) confirms that the required MBSFN configuration is commissioned in the network. When compared to the MBSFN configuration for band 5 , it had the same configuration but since these are two different network operators, it only confirmed they used the same network equipment vendor.
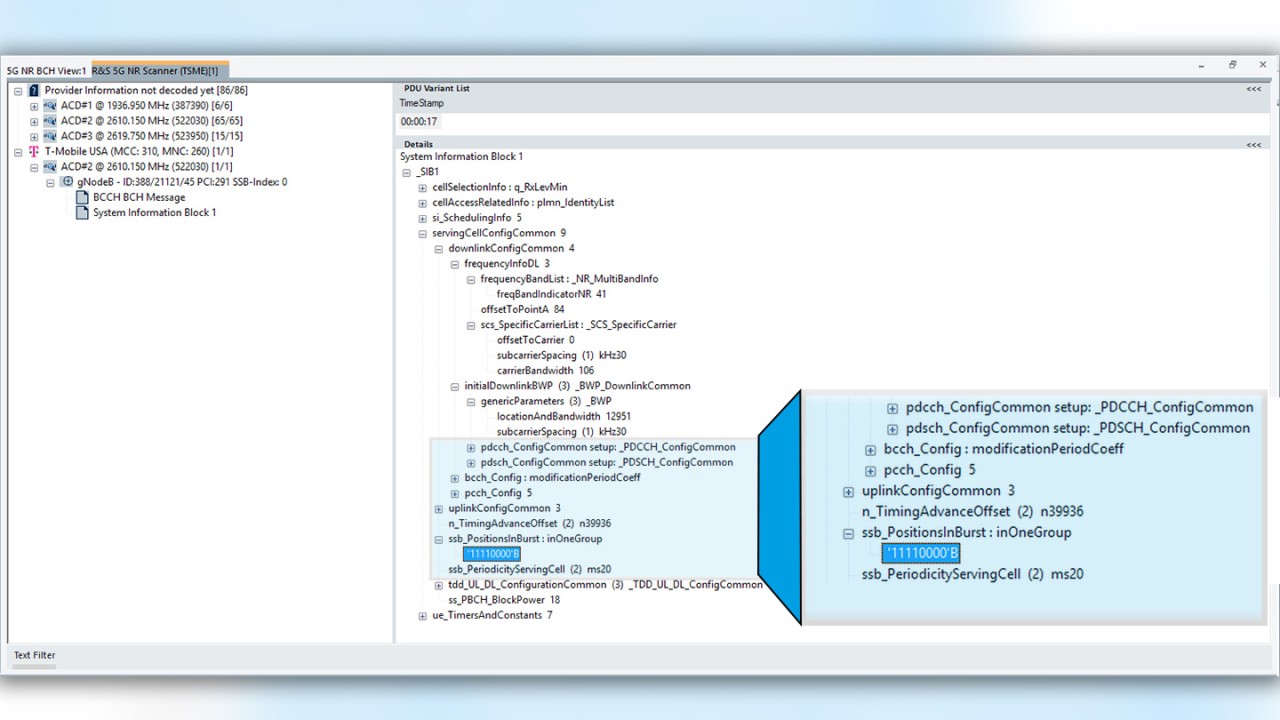
Finally, the scanner detected another SSB set in frequency band n41 and decoding SIB1 revealed a 100 MHz wide signal (PRB 106; see Table 1) using a subcarrier spacing of 30 kHz. A total of four different SSB indices were transmitted (Figure 8).
Validating DSS performance
The drive test used the setup described in part 3 of this blog.
The only active DSS deployment detected in the DFW metroplex was in the 850 MHz (Bd.5, n5) frequency band. The rest of the blog entry focuses on this particular signal and network configuration. To test the configuration performance, a commercially available Samsung Galaxy S20 5G device running commercial firmware was connected to our drive test system. Parallel HTTP download and upload acted as the KPI for overall network throughput during the driving test.
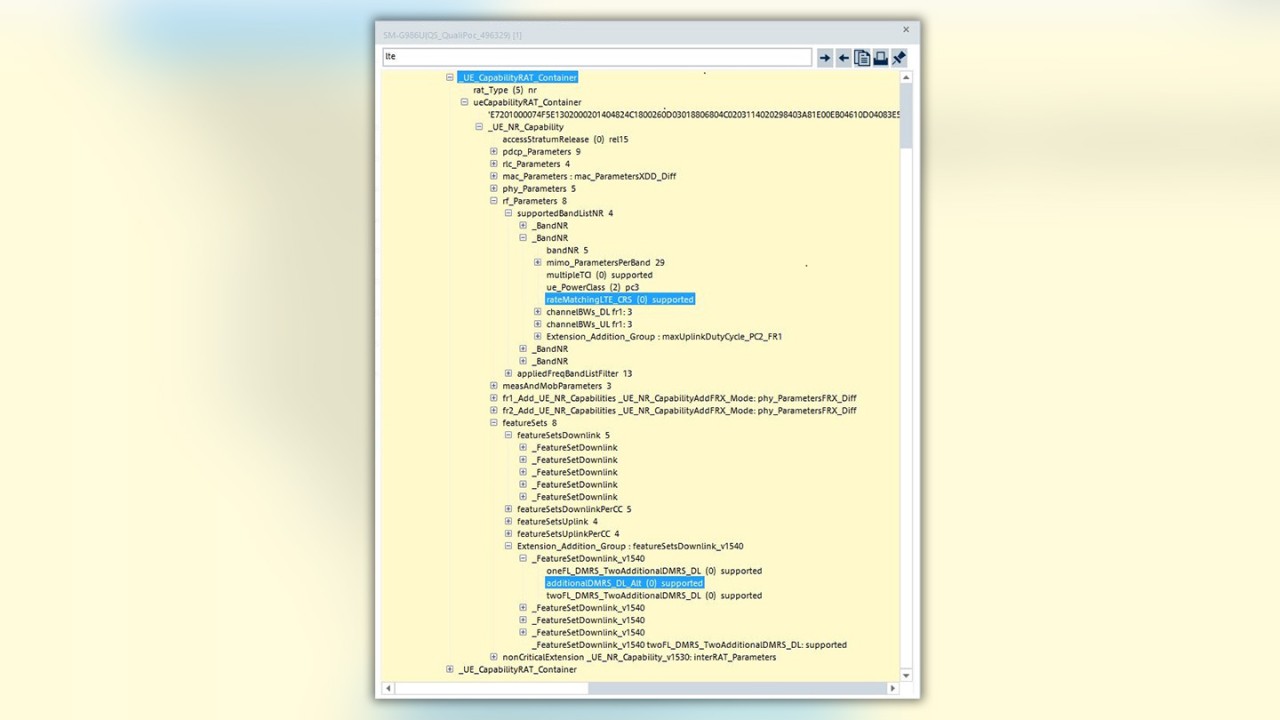
Before setting up a connection with the DSS, the network must determine whether the mobile device supports DSS. The information is provided during the user equipment capability enquiry when the device registers with the network. The terminal then indicates support for LTE CRS rate matching and for “alternative additional (PDSCH) DMRS position”; see figure 9 and part 2 of this blog series for further details.
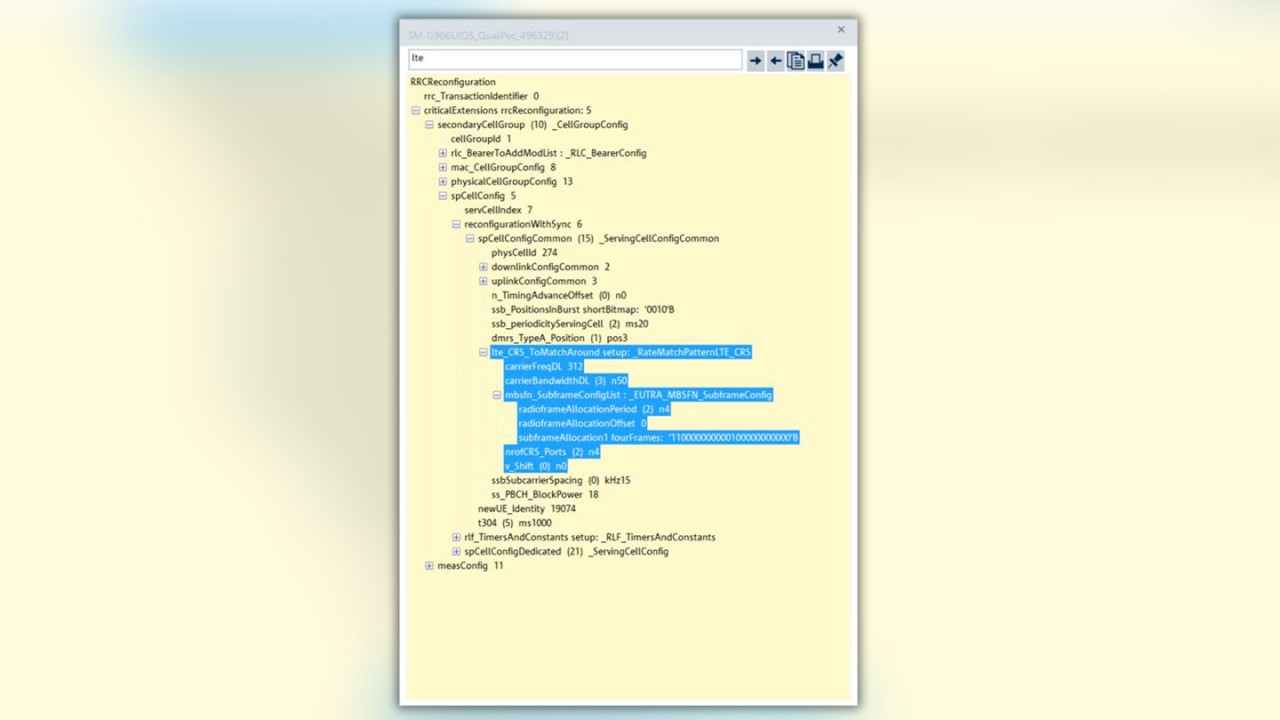
Once the mobile device confirms support for these features, the network can schedule a connection using DSS. The network transmits the required information to the device in the RRCReconfiguration message (figure 10). Together with other essential information, the signaling message contains the LTE CRS rate matching algorithm and detailed information about MBSFN subframes, since the special subframes do not require rate matching because no LTE CRS is present.
The performance test route crossed the DFW metroplex from west to southeast while constantly running a parallel data test, downloading and uploading 1 GByte files for maximum durations of 60 seconds and 30 seconds.
Figure 11 shows the connection mode during the driving test. The device was in EN-DC mode (light blue) almost the entire time, where EN-DC stands for EUTRA New Radio Dual Connectivity, the standard’s term for non-standalone mode.
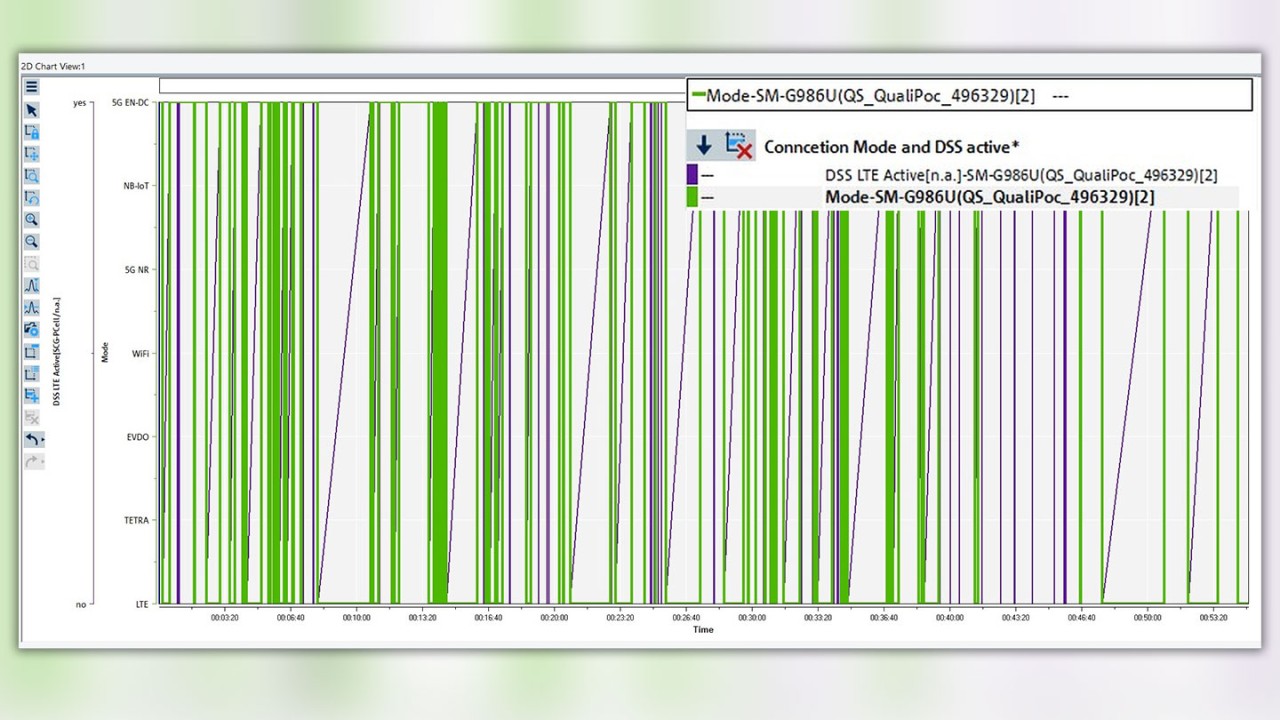
Figure 12 compares connection modes and whether DSS was active during the test (purple), meaning the 5G mobile device was connected to frequency band n5. The x-axis indicates a driving test duration of about an hour. The y-axis is stacked. The first y-axis (purple line) marks whether DSS was active (Yes) or (No) and switches between both states during the driving test. The second y-axis marks the device connection mode (green line) with 5G EN-DC (top of the axis) or LTE (bottom of the axis). The graph clearly indicates that as soon as the device entered EN-DC mode, DSS was active.
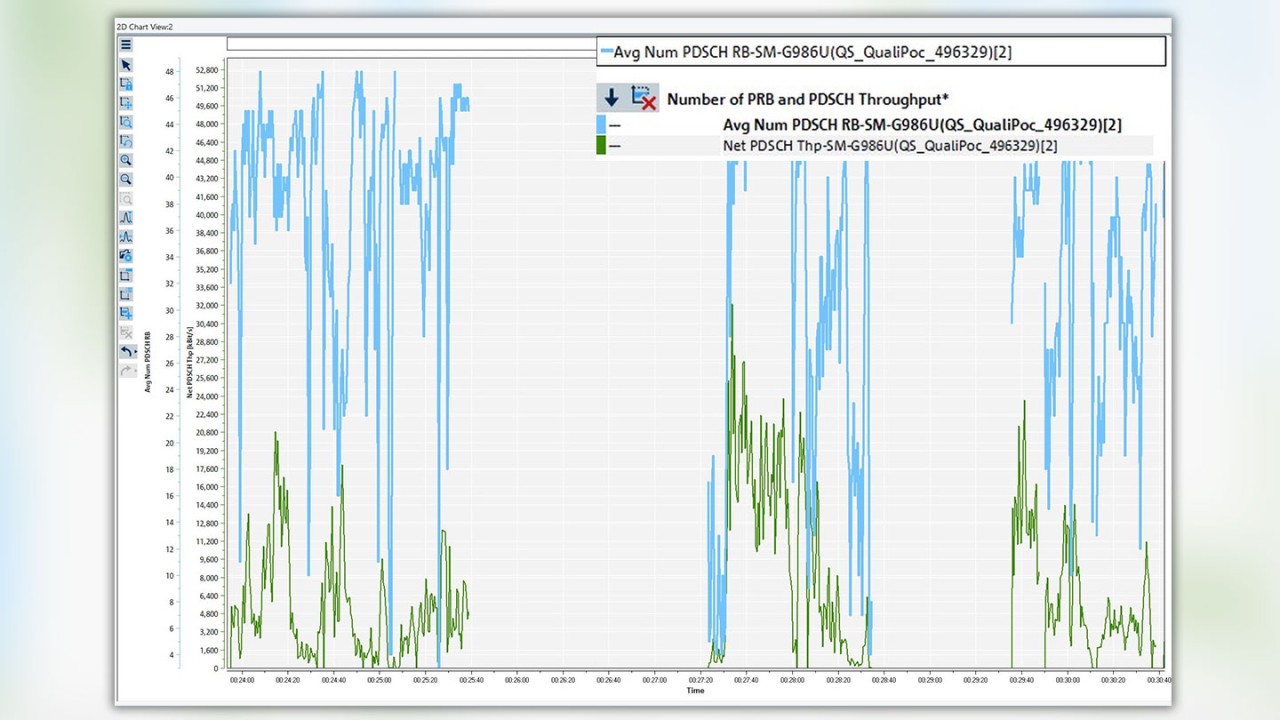
Figure 13 provides details on actual sharing. In this graph, the x-axis again shows the duration of the driving test. However, this time, we zoomed in between the minute 24 and 30 to look at some details of the driving test. The empty areas from 25:40 to 27:25 min and 28:35 to 29:35 min mark when the device was in LTE mode, not EN-DC mode. Therefore no PRB are scheduled for the PDSCH in frequency band n5, and there is no throughput contribution.
The y-axis in Figure 12 is stacked. The outer y-axis shows the number of scheduled resource blocks (RB) in the light blue curve. The green line shows throughput and is correlated to the second y-axis. Focusing our analysis on the middle block reveals that the device was scheduled to receive up to 18 RB of data via the (5G) PDSCH. This increased to nearly the maximum number of RBs (48) for greater data throughput, which was expected. Peak throughput achieved was about 32 Mbps. With 48 RB available for scheduling (10 MHz channel), the theoretical peak throughput for a SISO configuration is 42 Mbps; nearly doubling with MIMO 2x2.
Further analysis revealed that the device spent most of the time in a SISO connection, not MIMO. The results indicate that network performance engineers need to make an in-depth analysis about why the device was in SISO mode instead of MIMO.
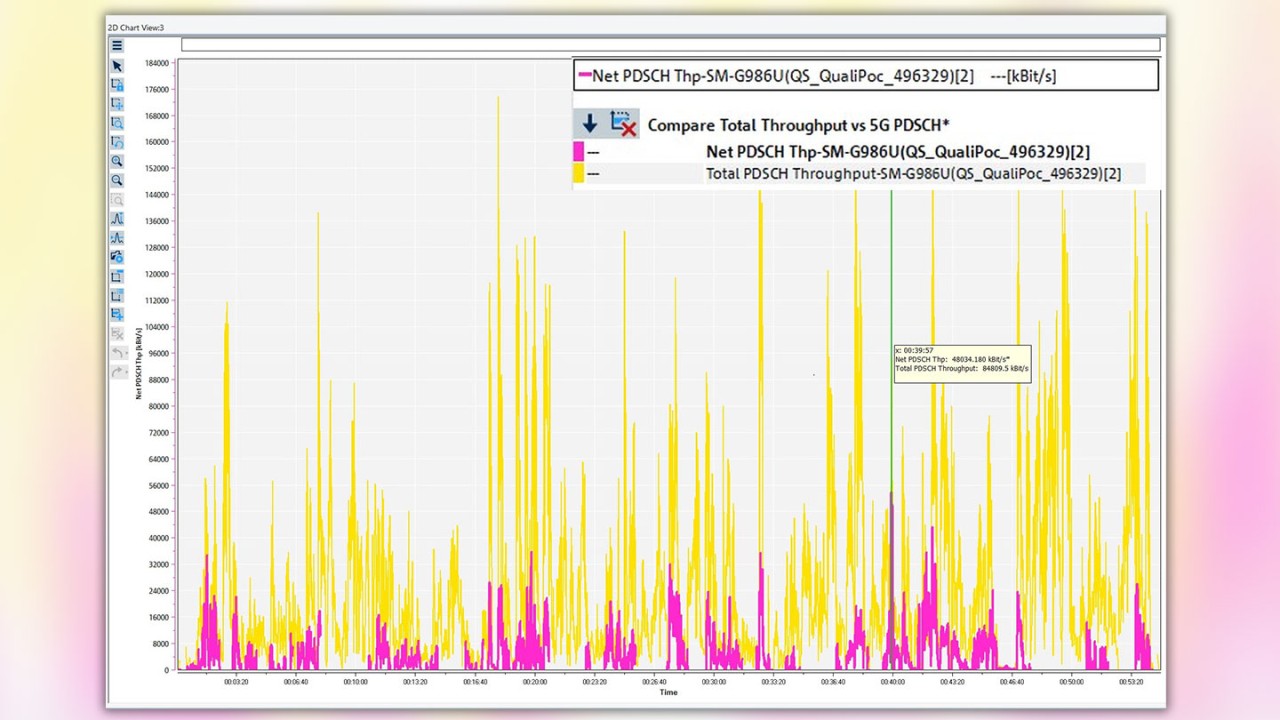
Comparing the 5G connection contribution via DSS to the total achievable throughput in the downlink and uplink is also interesting. Figure 14 shows the results for the PDSCH, where the major contribution comes from the carrier aggregation of various LTE frequency bands. At around 40:00 min, 5G throughput peaked for the driving test at 48.04 Mbps, with total throughput of 84.81 Mbps; 5G contributed almost 57% to overall throughput. Towards the end of the driving test at 53:35 min, overall throughput spiked to 229 Mbps, whereas the throughput for the 5G carrier in frequency band n5 was 14.7 Mbps. The DSS connection only contributed 6.42% at this point.
The blog post discusses initial measurement results when DSS is active in a commercial network. The results confirm that DSS is a transition technology that allows LTE and NR to coexist by sharing access to the same frequency band. As more and more subscribers have access to 5G devices, the technology will enable a smooth “reframing” of frequency bands now used exclusively by 4G LTE.
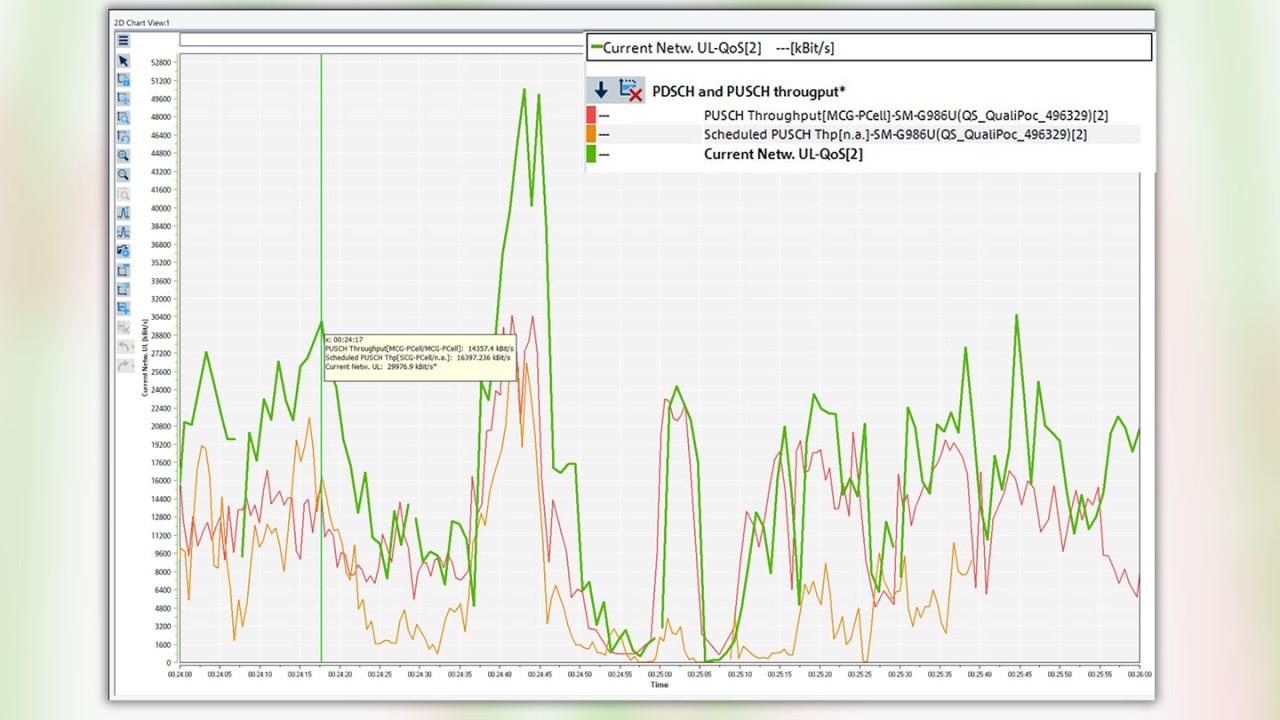
From figure 15 we zoom into some details of the uplink data throughput and examine the situation between minutes 24 and 26 of the driving test. Once DSS is active, the two component carriers contribute to the overall PUSCH throughput (green curve). This is the uplink component carrier for the LTE anchor (red curve) and the DSS uplink carrier in frequency band n5 (orange curve). At the 24:17 min marker the overall throughput reached ~30 Mbps, with the LTE anchor and DSS carrier each contributing about 50% of the data throughput.
Read more about dynamic spectrum sharing in our article series:
DSS: 5G NR-LTE coexistence through dynamic spectrum sharing (part 1)
DSS: Enabling 5G NR in standard LTE subframes (part 2)
DSS: Measurement aspects of testing LTE and 5G networks (part 3)


![Figure 11: Connection mode during drive test: 5G EN-DC (light blue) or LTE only (yellow) [Result exported to Google Earth] Figure 11: Connection mode during drive test: 5G EN-DC (light blue) or LTE only (yellow) [Result exported to Google Earth]](https://cdn.rohde-schwarz.com/pws/solution/mobile_network_testing/mnt_blog/dss_measurement_examples_part4/11_Figure11_w1280_hX.jpg)
