Key facts
- Bandwidth: 10 Hz .. 25 MHz (RTx) | 0.01 Hz .. 100 MHz (MXO)
- Test modes: fixed or custom amplitude profile
- Up to 500 points per decade: logarithmic gain and linear phase
- Analysis: waveform cursors and tabular view of test results



Key facts
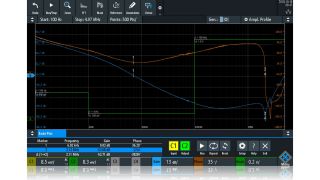
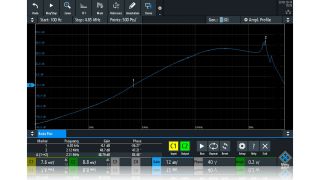
The R&S®MXO and R&S®RTx-K36 frequency response analysis (Bode plot) option let you perform quick and easy low-frequency response analyses on your oscilloscope. They characterize the frequency response of a variety of electronic devices, including passive filters and amplifier circuits. The control loop response and power supply rejection ratio for switch mode power supplies can also be measured. The stimulus can be generated with a B6 built-in waveform generator. By measuring the ratio of the stimulus signal to the DUT output signal at each test frequency, the oscilloscope logarithmically plots gain and phase.
The K36 frequency response analysis (Bode plot) option can be used to configure the amplitude profile of the generator output . The option helps suppress DUT noise behavior during control loop response or power supply rejection ratio measurements and improve the signal-to-noise ratio (SNR). It is possible to define up to 16 steps on RTx and 100 steps on the MXO
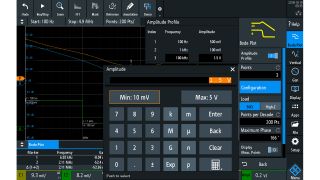
Amplitude profile
The amplitude output level of the generator signal can be varied during measurements to suppress DUT noise.
You can choose points per decade to set up and modify your plot resolution. The oscilloscope supports up to 500 points per decade. Markers can be dragged directly to the desired position on the plotted trace. A legend displays the marker coordinates. To determine the crossover frequency, set one marker to 0 dB and the second to –180° phase shift. Phase and gain margin are now easy to determine.
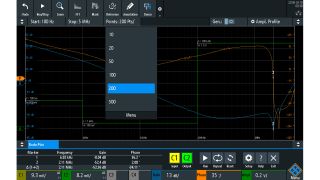
Vary points per decade
Measurement resolution can be varied by changing the points per decade
The results are also available in a table. The measurement result table has detailed information about each measured point, including frequency, gain and phase shift. To make cursors easier to use, the row in the result table is highlighted. Screenshots, table results or both can be quickly saved to a USB device for reporting .
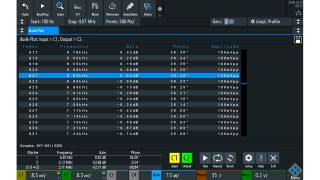
Measurement table
A measurement result table has detailed information about each measurement point, consisting of frequency, gain and phase shift
Accurate characterization of control loop responses or power supply rejection ratios requires the right probes, since peak-to-peak amplitudes of both Vin and Vout can be very low for certain test frequencies. The values can be buried in the oscilloscope noise floor or in the DUT switching noise. We recommend low-noise R&S®RT-ZP1X 38 MHz bandwidth 1:1 passive probes. The probes reduce measurement noise and have the best SNR.

R&S®RT-ZP1X 38 MHz 1:1 passive probe
The low-noise passive probe reduces measurement noise and has the best SNR.
Related products


