Written by Jens Berger | February 17, 2022
This study looks at data latency in real-field mobile networks. Recently, we discussed how distance to the server can impact latency and jitter. Now, we will make a more granular analysis of how long is needed to transport data packets in mobile channels when the network conditions are constantly changing. The changes mainly stem from the user moving around but can also come from suboptimal coverage and congested networks.
Again, data transport latency is one of the most important factors in interactive and real-time use cases in mobile networks. Ultra-reliable, low latency communications (URLLC) that enable very short latency periods over radio links are a key promise of 5G technology. URLLC requires a server at the network edge that is perfectly connected to the core network. Even though radio link technology supports very short latency, this needs to be true for each packet and we must determine performance when moving as well under imperfect radio channel conditions. Real-time capability is not determined by the fastest packets delivered but by those delivered last.
How the latency was measured
To obtain realistic latency measurements, a typical data stream for real-time applications was emulated as using the two-way active measurement protocol (TWAMP) in line with IETF RFC 5357. It is based on the user datagram protocol (UDP) applied for most real-time network communications. We transported thousands of UDP packets to a network server and back. We selected packet frequencies and sizes typical for real-time applications. The packets were directly sent and captured using an IP-socket interface in a state-of-the-art smartphone. This architecture prevented additional delays from upper layers in the Android operating system and acted as a technical measurement or application most resembling a real-time interface for a mobile client.
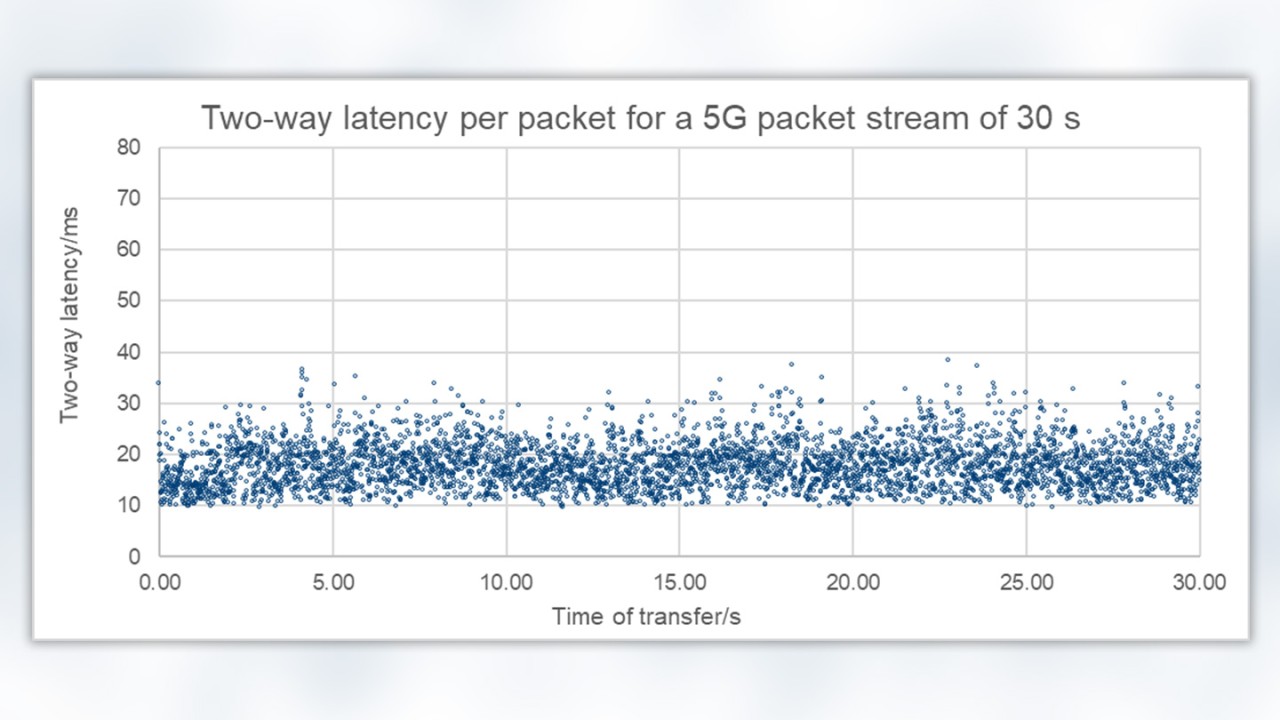
We transferred packets for 30 s with a bitrate of 300 kbit/s and measured the two-way latency from the transmitting mobile client to the reflecting server and back.
This result is very similar to the previous blog entry but this time uplinks and downlinks used 5G carriers with a 5G non-standalone connection, resulting in shorter two-way latency of 10 ms. This scenario quickly reveals that latency is not a constant for a given connection or mobile channel, since transport packets are buffered and queued at several stages before traveling onward. Such intermediate buffering not only happens at the UDP and IP level, but also in lower layers as transport blocks.
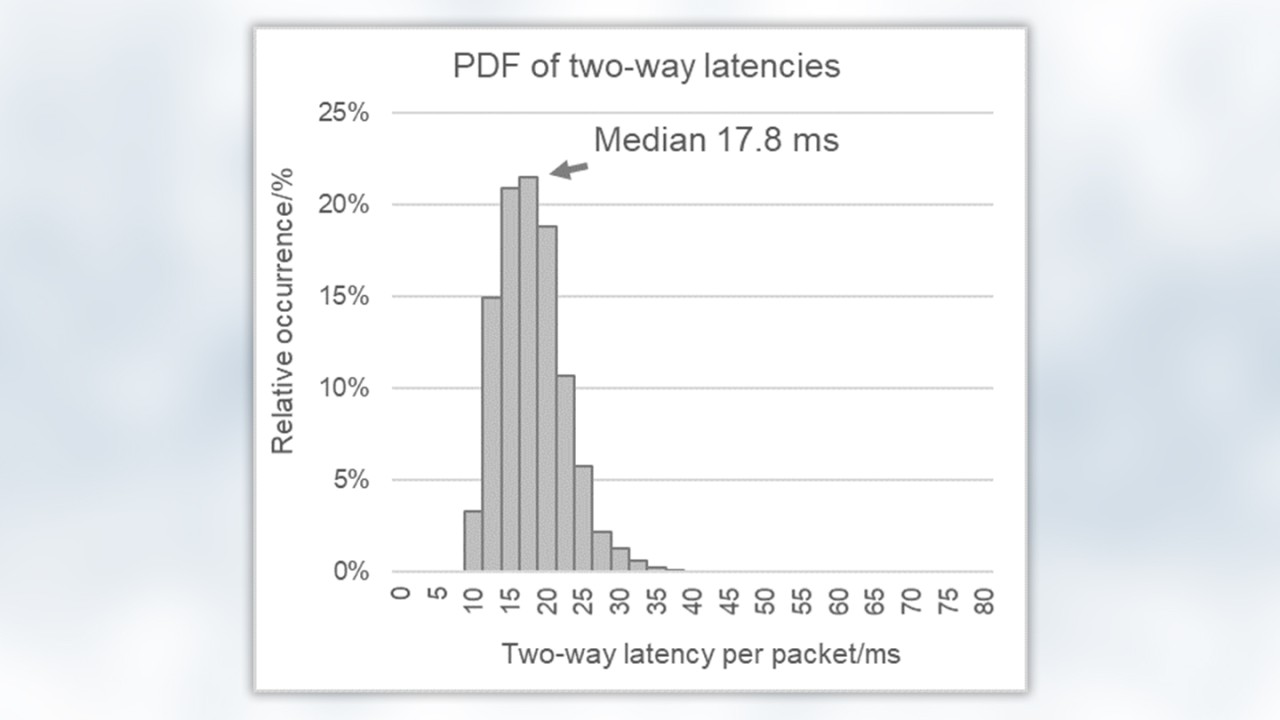
Two-way packet latency in a 30 s packet stream had a slight log-normal distribution. The majority of packets clearly had latency in a narrow band above the lower limit while being much faster than the most delayed packets.
However, the transport time variation is as important as the median rate and a jitter indicator is to determine this variation. IETF RFC 5481 requires the use of packet delay variation (PDV) in measurements. The packets with the longest transport times determine real-time service capacity. 3GPP requires a one-way transport time of 50 ms for real-time applications such as eGaming or 100 ms when considering uplink and downlink together. The steady example above would easily meet this requirement. However, new services and applications such as factory automation or drone control require reducing this very tight delay tolerance even further to a range of 10 to 40 ms round-trip.
How packet latency and delay variation depend on mobile technologies
A mobile channel does not have the constant transfer conditions found in a fiberoptic connection. Transport capacity depends on local radio conditions, which can change through the physical motion of the mobile client and changes in the network load caused by other subscribers. Lower channel quality can reduce data transport along with the network reconfiguration caused by switching cells, adding or releasing additional carriers, changing frequencies or even transport technologies.
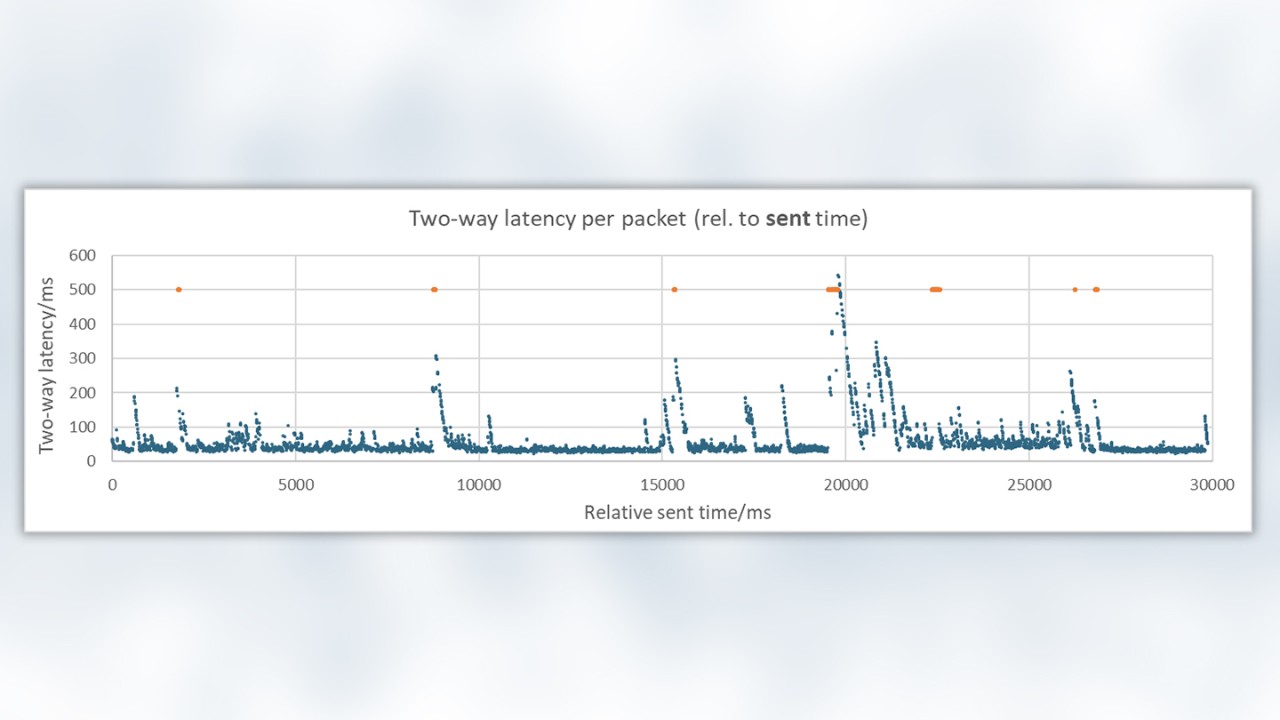
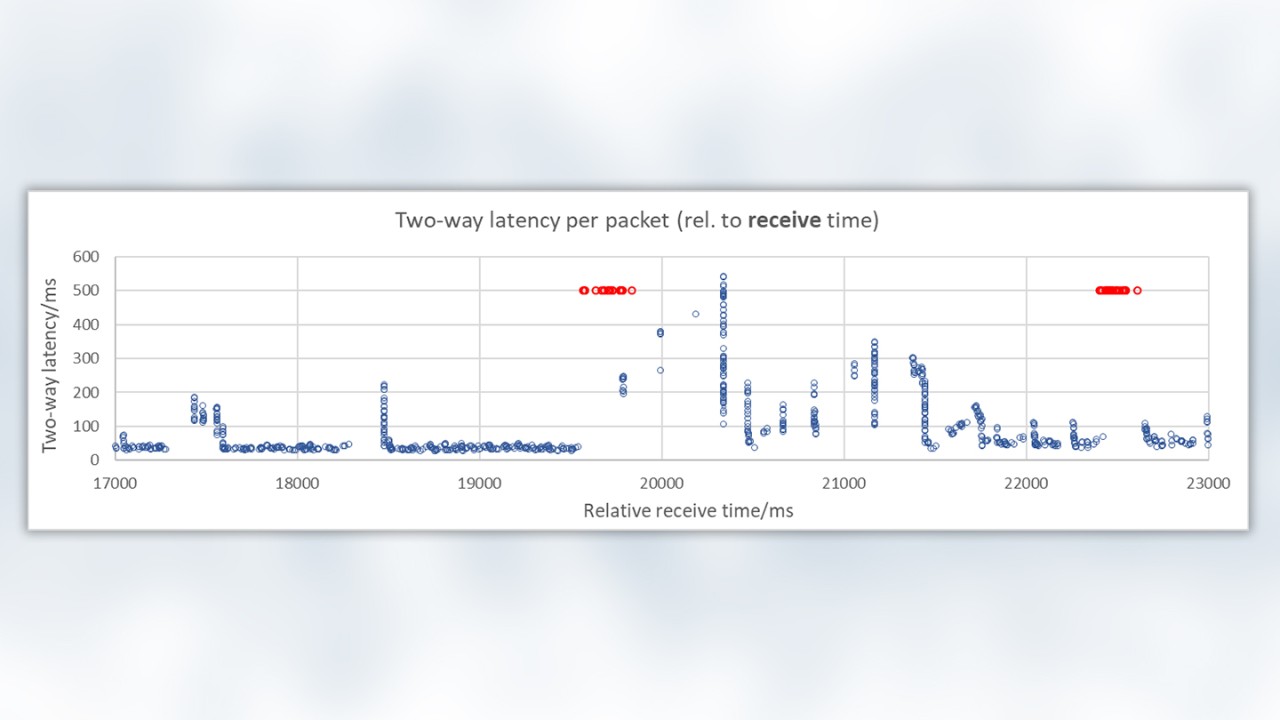
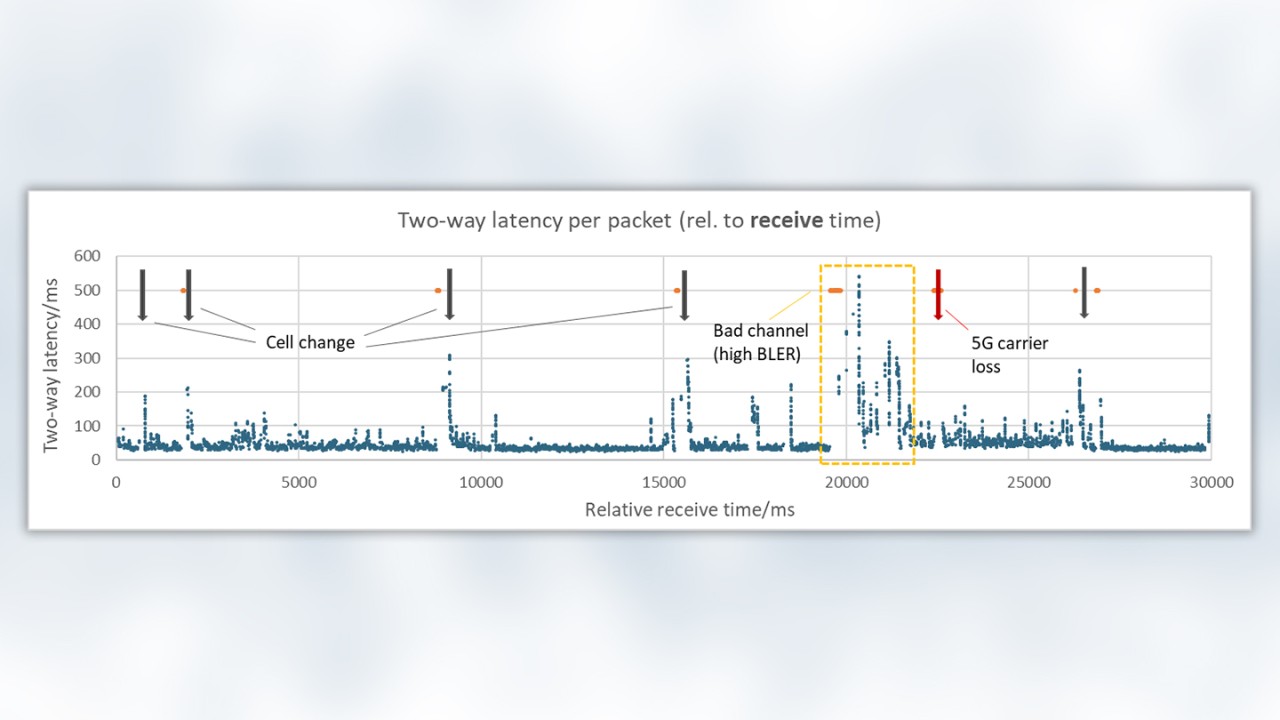
We want to study latency in detail. The packet stream above consists of 150 packets per second of 250 bytes each for a 300 kbit/s data rate. The image below is typical when examining packet delay time when network conditions change. Each blue dot represents a received packet. Please note that the y-axis in the graph is extended to 600 ms to cover very long transport times. The red dots represent expected packets that were lost or corrupted and not received finally. The lost packets were given an artificial 500 ms latency to improve visibility.
The first graph shows the two-way packet transport times relative to the time-stamps when the packet starts its travel on the sending side. This relates to a technical reaction time in an interactive application.
There are areas where packets travel much longer than normal in such an environment. Single packets are delayed but larger groups of packets resemble asymmetric saw teeth. A data channel is not a wire or circuit that is cut off at a certain point. Data transport is packet-wise and consists of many subsequent partial transport components resembling links in a chain. Such latency patterns are typical when packets are temporarily queued or buffered in a network because of temporary transport problems.
A first-in/first-out pattern is typical for a buffered network but filling and emptying speeds can differ. We can imagine a buffer filled with incoming packets (or rationales at lower layers), where every 1/150 s a packet arrives and is stored causing the buffered data to pile up. The longer the data remains in a buffer the greater the latency.
Once transport in the channel resumes and the data moves onward, the buffer empties as quickly as possible with all the packets or blocks sent one after the other. The first buffered packet spends the longest time in the buffer, while the most recently arrived packet leaves the earliest, creating a slope of decreasing latency. The packets transferred after the channel has recovered are not retained and pass through to keep latency within the expected limits.
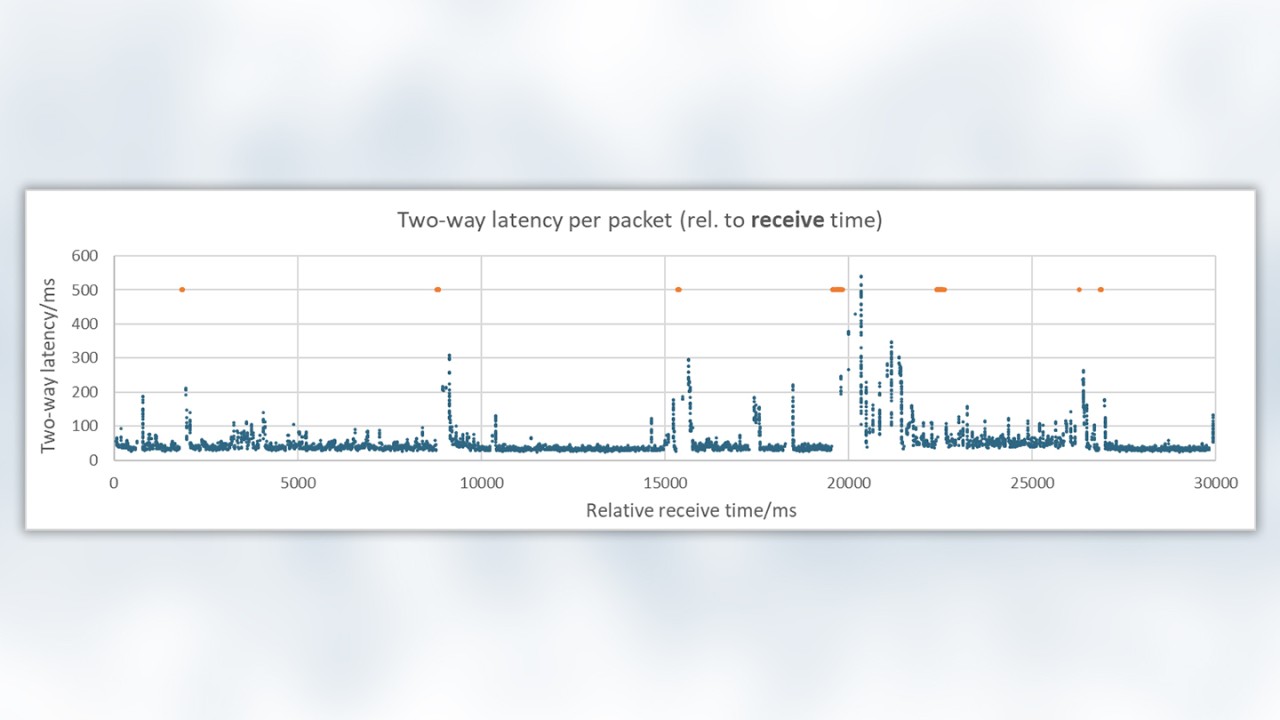
The situation becomes even more clear for latency relative to receive time. After a holding period, packet transport resumes and buffered packets are transported onward as quickly as possible. The picture is a visualization based on receive times and gives an impression of the interruptions in the packet flows or periods, where no packets are arriving even though they should be.
This quickly shows that any gaps are immediately followed by a series of packets received at the same time.
Next, we take a closer look at these gaps and their slopes. The latency peaks have different heights and typically have preceding periods without any packets arriving and sometimes packets are even lost prior to a peak.
This underlines the assumed temporary storage of data in buffers in the event of insufficient or interrupted transport channel capacity.
Let us look at packet losses. Of course, individual packets are lost from time to time, but multiple packets tend to be lost just prior to a latency peak, when temporary buffering obviously occurs. Data can actually get lost due to transport problems and prior to the data being held in the buffer. However, the temporary buffers are most likely overloaded and the packets stored the longest are discarded.
What is behind severe peaks in network latency and buffering?
A steady data channel with sufficient transport capacity does not have latency peaks but only has the jitter found in the first picture. All the dramatic latency peaks are either from changes to the transport chain and its routing due to network reconfiguration or from insufficient data transport capacity.
The 30 s data stream in our example was recorded in a drive test campaign with cell changes every few seconds. Even when there is slower movement such as walking in dense areas, the situation is still relatively unstable. Each cell change temporarily causes latency to increase by 200 to 300 ms. The interruption durations show that no packets are received for a similar amount of time. The delays may not impact typical download-based services such as browsing or even video streaming, where a jitter-buffer can cope with a few seconds of interruptions. However, these delays are a severe problem for real-time interactions such as audio-visual communications and truly critical applications such as real-time controls.
Switching cells is often associated with initial packet loss, either from buffer overrun or other reasons.
The example above also indicates bad channel conditions caused increased BLER. The poor channel quality triggers retransmissions and interruptions in further delivery that also cause buffering. The high number of lost or corrupted packets here are also typical. As a consequence, packet delays fluctuate severely and can even exceed 500 ms in this example.
Finally, the example also shows the effect of losing a 5G carrier, which triggers an interruption of about 200 ms. However, the data could not be queued since there is no visible latency peak and is lost for this period of time.
Many other network reconfigurations cause similar or greater latency. These include adding a carrier, releasing a carrier and inter-frequency or even inter-technology handovers.
Latency measurements with Rohde & Schwarz MNT products
Measurement tools normally use ping measurements to derive data latency. However, a ping uses a dedicated protocol and is not very useful at emulating the real data flows typical for real-time applications.
Rohde & Schwarz has implemented the two-way latency measurement method in line with IETF RFC 5357 for more realistic packet streams. It provides results for each individual packet and uses UDP like almost all real-time applications in the field. The network treats the method as real application data but access to the measurement probe is closest to the IP interface and latency and interactivity test results focus on transport and are not passed to the upper layers of the operating system.
The interactivity test measures latency at the packet level for insights into its root cause and integrates the QoE results into an interactivity score. This is supported by all Rohde & Schwarz MNT products, from measurement probes such as QualiPoc Android to the Smart Analytics reporting and analysis tools.
Read more about interactivity test in part 1 - 8 of this series and download our white paper "Interactivity test":
Interactivity test: QoS/QoE measurements in 5G (part 1)
Interactivity test: Concept and KPIs (part 2)
Interactivity test: Examples from real 5G networks (part 3)
Interactivity test: Distance to server impact on latency and jitter (part 4)
Interactivity test: Packet delay variation and packet loss (part 6)
Interactivity test: Dependency of packet latency on data rate (part7)


